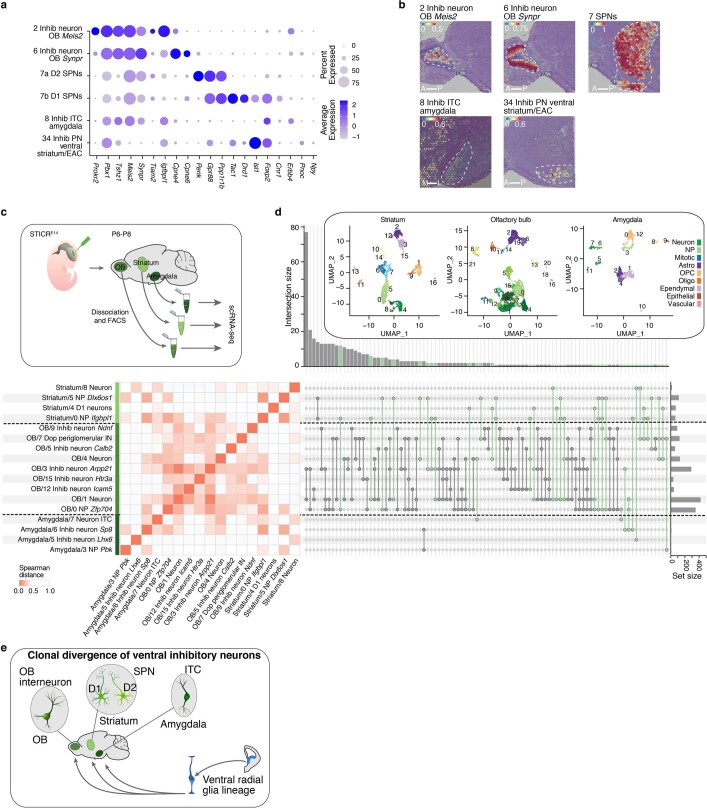
Extended Data Fig. 8. Lineage divergence in ventral inhibitory neurons.
a, Dot plot showing gene expression markers of ventral inhibitory neuron clusters. The size of the dots indicates the percentage of cells expressing a specific marker gene. The colour of the dots represents the average expression level. EAC, central extended amygdala; Inhib, inhibitory; MGE, medial ganglionic eminence; OB, olfactory bulb; PN, projection neuron; SPN, spiny projection neuron. b, Spatial transcriptomic mapping showing localization of ventral inhibitory neuron clusters in the mouse brain. c, Schematic representing the workflow for the manual dissection of striatum, olfactory bulb (OB), and amygdala from P6-P8 brains injected with STICRE14. d, UpSet plot displaying clonal intersections amongst and within neuronal clusters of striatum, OB and amygdala. Only dispersing clones are shown. Bar graph on top indicate the number of observed intersections. The total cell number per cluster is represented on the right bar plot. Intersections amongst striatum, OB and amygdala are coloured in green. The heatmap shows the Spearman distance between the log-normalized average cluster gene expression. The insets (top right) are UMAP plots of single cells from striatum, OB and amygdala datasets, with clusters coloured by cell class type. NP, neuronal precursor. e, Schematic of lineage divergence for ventral inhibitory neuron cell types.

