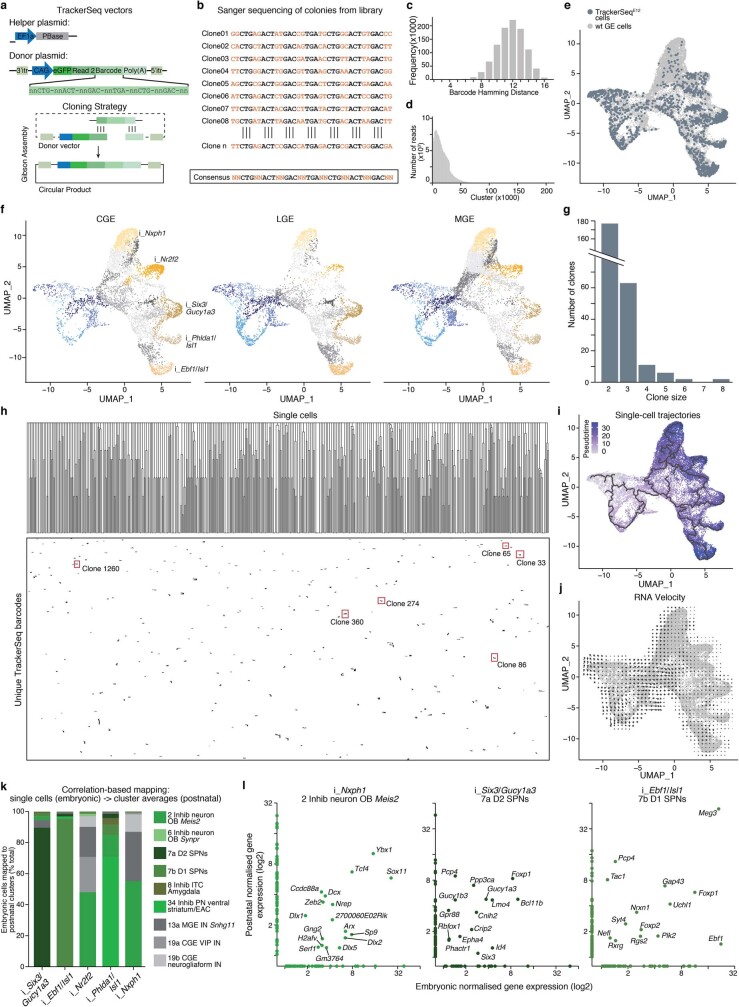
Extended Data Fig. 9. Characterization of TrackerSeq.
a, Vector maps and cloning strategy of TrackerSeq. PBase: piggyBac transposase. b, Sanger sequencing results of individual E. coli colonies ('clones'), depicting the consensus sequence of the TrackerSeq lineage barcode. c, Pairwise hamming distance of 1000 barcodes randomly sampled from the TrackerSeq library. d, ~3.6 x 10⁶ raw sequencing reads were collapsed into ~2 x 10⁵ clusters, where each cluster is defined as a unique lineage barcode. e, UMAP plot of embryonic scRNA-seq datasets, cells coloured by dataset type (blue, TrackerSeq; grey, wild type). f, UMAP plot of single cells from the caudal, lateral and medial ganglionic eminences (CGE, LGE, MGE) of wild type (wt) embryos, coloured by clusters from Fig. 3c. g, Histogram showing distribution of clone sizes for TrackerSeq dataset. h, Clustered heatmap of TrackerSeqE12 barcodes. Rows are single GABAergic precursor cells for which both transcriptome and >1 TrackerSeq barcodes were retrieved; column represents unique TrackerSeq barcodes. Highlighted barcodes are those represented in Fig. 3i. i, Developmental trajectories of single-cell transcriptomes, coloured by pseudotime score. j, RNA Velocity plot. Arrows direction represent prediction of cells’ future gene expression. k, Bar graph quantifying the correlation-based mapping of cells from the 5 embryonic precursor states to clusters of postnatal GABAergic forebrain neurons, including cortical interneuron types. EAC, central extended amygdala; IN, interneuron; Inhib, inhibitory; NP, neuronal precursor; OB, olfactory bulb; PN, projection neuron; SPN, spiny projection neuron. l, Scatter plots showing the normalized average cluster gene expression of the top 100 marker genes for a selected embryonic cluster and the top 100 marker genes for a selected postnatal cluster. Clusters were selected based on the mapping efficiency.

