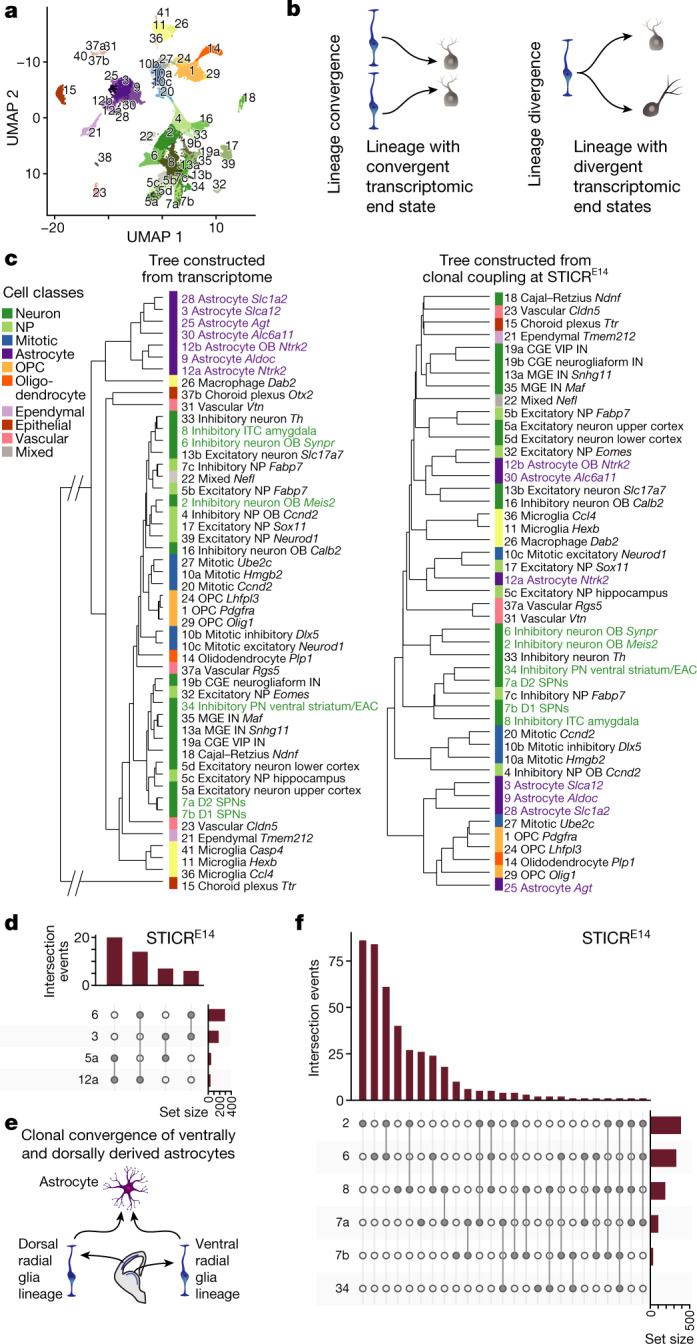
Fig. 2. Lineage convergence and divergence in the mouse forebrain.

a, UMAP plot of single cells from the forebrain coloured by cluster. b, Schematics of patterns of lineage convergence and divergence. c, Dendrograms representing cluster relationships based on transcriptomic similarity (left) and lineage coupling correlations (STICRE14, right). In purple are examples of lineage convergence; in green are examples of lineage divergence. CGE, caudal ganglionic eminence; EAC, central extended amygdala; IN, interneuron; MGE, medial ganglionic eminence; NP, neuronal precursor; PN, projection neuron; VIP, vasoactive intestinal polypeptide. d, UpSet plot of selected intersections for STICRE14. Only dispersing clones are shown. The bar graph at the top shows the number of observed intersections, and the bar graph on the right shows the number of cells per cluster. e, Schematic for lineage convergence of astrocyte clusters 3 and 12a. f, UpSet plot for selected ventral inhibitory neuron types in STICRE14. The bar graph at the top shows the number of observed intersections, and the bar graph on the right shows the number of cells per cluster.
