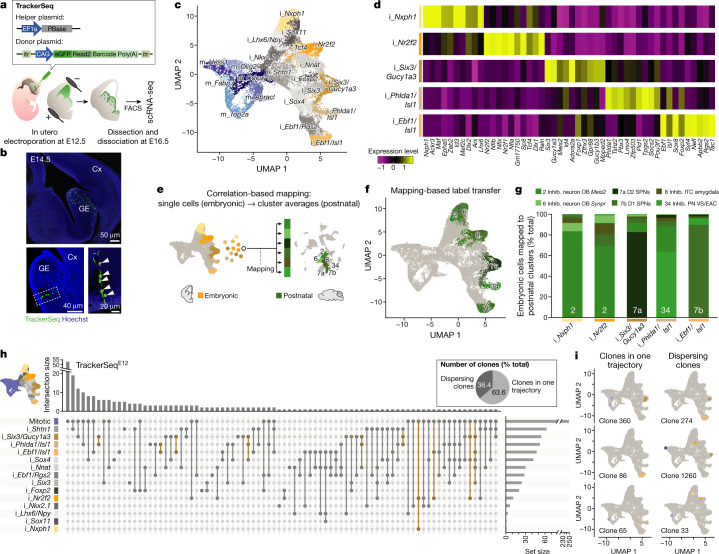
Fig. 3. Newly born GABAergic sister cells diverge into different precursor states.
a, Schematic of the TrackerSeq experimental workflow. PBase, piggyBac transposase. b, Images of coronal brain sections electroporated with TrackerSeqE12 and collected at E14.5. Cx, cortex; GE, ganglionic eminence. Magnification on the bottom right panel shows a radial cluster of newborn cells (white arrowheads). c, UMAP plot of integrated embryonic scRNA-seq datasets, coloured by clusters. i, inhibitory; m, mitotic. d, Heatmap showing the normalized expression of the top ten marker genes for the five precursor states. e, Schematic of the strategy for computationally mapping embryonic precursor state cells to postnatal clusters. f, UMAP of the embryonic dataset, with precursor state cells coloured based on the mapping results. g, Bar graph quantifying the correlation-based mapping of cells from the five precursor states to selected postnatal ventral GABAergic neuron clusters. The numbers on the bars indicate the dominant mapped postnatal cluster. Inhib., inhibitory; VS, ventral striatum. h, UpSet plot for all intersections of TrackerSeqE12. The bar graph on the top shows the number of intersections. Mitotic clusters were merged in a single cluster (mitotic). The total cell number per cluster is represented in the bar graph on the right. Intersections among precursor states are coloured in ochre. The bars are colour-coded according to Fig. 3c. The inset in the top right represents the percentage of multicellular clones that follow a single trajectory or dispersed across several precursor state trajectories. i, Examples of clones where sibling cells traverse a single developmental trajectory (left) or different trajectories (right) on the UMAP.

