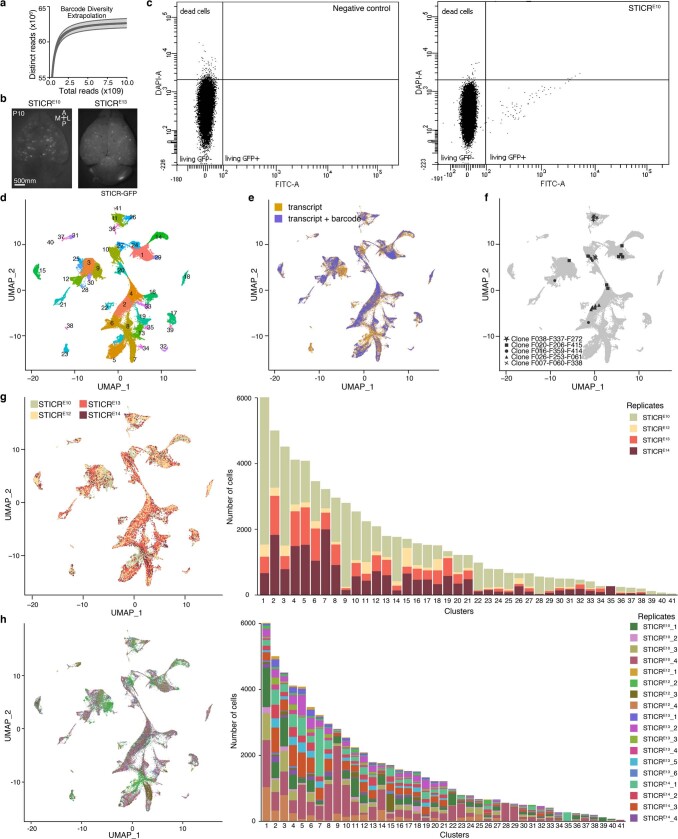
Extended Data Fig. 1. Characterization of STICR datasets.
a, Barcode diversity extrapolations derived from sequencing ca. 30 million reads of a representative STICR plasmid library. Mean ± 95% CI. b, Images of whole mount brains injected with STICR. c, Representative FACS gating for negative control (matching non-injected brain) and STICRE10. d, UMAP plot coloured and numbered for each unsupervised cluster. Each dot represents a single cell. e, UMAP plot coloured by cells with recovered transcriptome and cells with recovered transcriptome and lineage barcode. f, Examples of clones on UMAP plot. Sibling cell relationships represented by shapes (dot, square, star, cross, triangle). g, UMAP plot and bar graph showing the distribution of recovered cells, coloured by stage of injection. h, UMAP plot and bar graph showing the distribution of recovered cells, coloured by experimental replicate.

