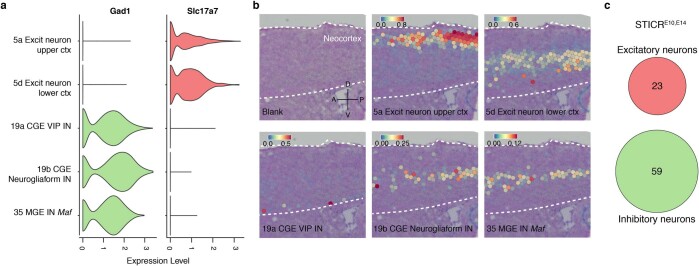
Extended Data Fig. 6. Excitatory and inhibitory lineages do not overlap in the murine cortex.
a, Violin plots showing the normalised marker gene expression Slc17a7 (marker gene for excitatory neurons) and Gad1 (marker gene for inhibitory neurons). CGE, caudal ganglionic eminence; Ctx, neocortex; Excit, excitatory; IN, interneuron; Inhib, inhibitory; MGE, medial ganglionic eminence. b, Spatial transcriptomic mapping showing localization of cortical neuron clusters in the mouse brain. c, Venn diagram quantifying the number of clones within excitatory and inhibitory clusters.

