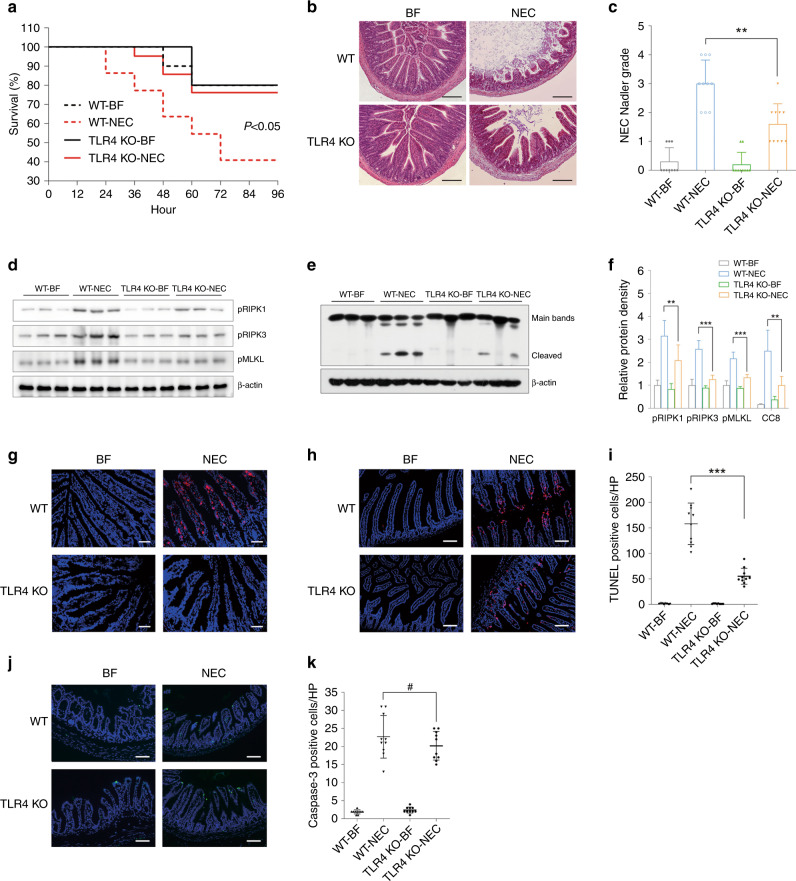
Fig. 7. TLR4 knockout protected against NEC partly by inhibiting necroptosis.
a The survival rate of neonatal mice in each group. n = 10 in either of the BF group, n = 22 in the WT + NEC group, and n = 21 in the TLR4-KO + NEC group. b Typical hematoxylin and eosin staining of the distal ileum in each group, magnification = ×100, bar = 100 μm. c The Nadler’s grade, n = 10 in each group. d Western blotting of necroptosis-related proteins. e Western blotting of phosphorylated caspase-8 (cleaved bands). f Relative protein density of the above-mentioned proteins. n = 6 in each group. g Typical immunofluorescent staining of phosphorylated RIPK3 in each group. Magnification = ×200, bar = 50 μm. h Typical TUNEL staining of the distal ileum in each group. Magnification = ×200, bar = 50 μm. i Numbers of TUNEL-positive cells per field, n = 10 in either group. j Typical immunofluorescent staining of cleaved caspase-3 of the distal ileum in each group. Magnification = ×200, bar = 50 μm. k Numbers of cleaved caspase-3 positive cells per field, n = 10 in either group. WT wild-type mice, TLR4 KO mice with global TLR4 knockout, BF breastfeeding under a physiological status, NEC neonatal mice that underwent formula feeding and cold/asphyxia stress, CC3 cleaved caspase-3. WT + NEC vs TLR4 KO + NEC, #p > 0.05, **p < 0.01, and ***p < 0.001.

