
Fig. 3.
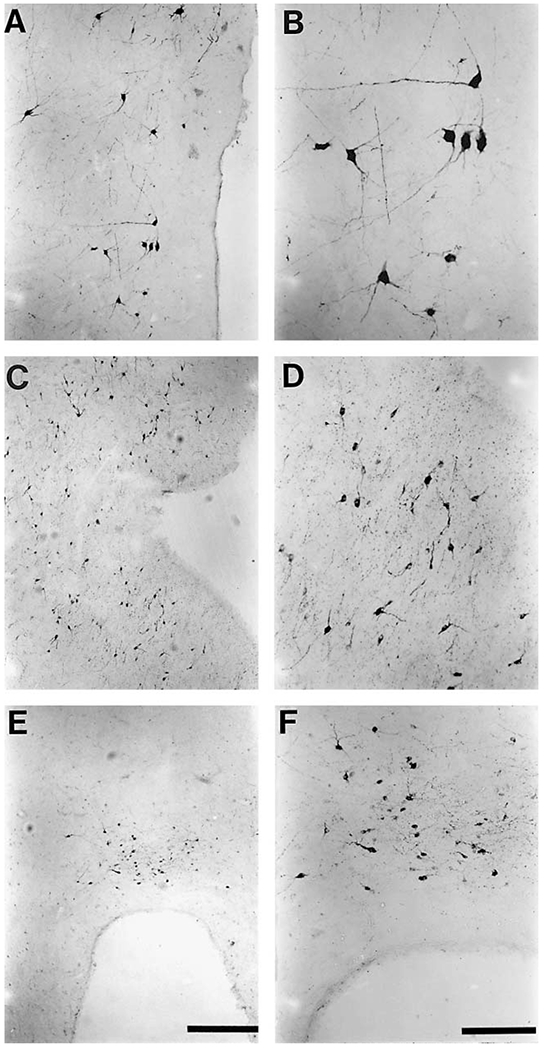
Photomicrographs of representative TH-ir neurons from the various subdivisions of the diencephalon and midbrain of the bottlenose dolphin. Both low power micrographs (A, C, E) which give an indication of density and high power micrographs (B, D, F) showing the cellular structure are provided for the A11 (A, B), A12 (C, D) and A14 (E, F) clusters that were observed. Note the large size of the A11 neuronal bodies (B) in comparison to those of the A12 (D) and A14 (F) neuronal bodies. Scale bar in E = 500 μm and applies to A, C and E; scale bar in F = 200 μm and applies to B, D and F.