
Fig. 4.
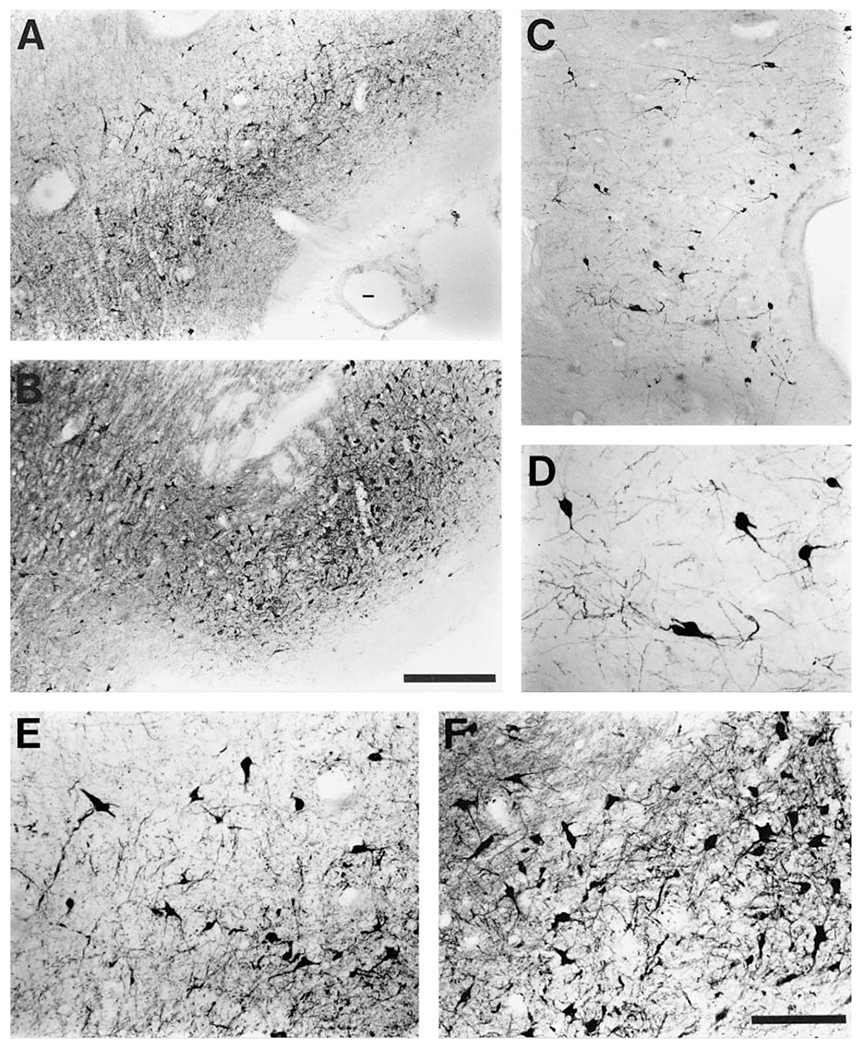
Photomicrographs of representative TH-ir neurons from two subdivisions of the ventral tegmental region (A10 group) of the bottlenose dolphin and the ventral lateral periaqueductal gray matter cluster (VLpag). Both low-power micrographs (A, B, C) which give an indication of density and high-power micrographs (D, E, F) showing the cellular structure are provided for the A10 medial (A, E), A10 lateral (B, F) and VLpag (C, D) clusters that were observed. Note the similarity in size of the A10 medial and lateral neuronal bodies, but the larger size of the VLpag neuronal bodies. The density of neurons is lower in VLpag than the subdivisions of the A10 region. Scale bar in B = 500 μm and applies to A, B and C; scale bar in F = 200 μm and applies to D, E and F.