Figure 1.
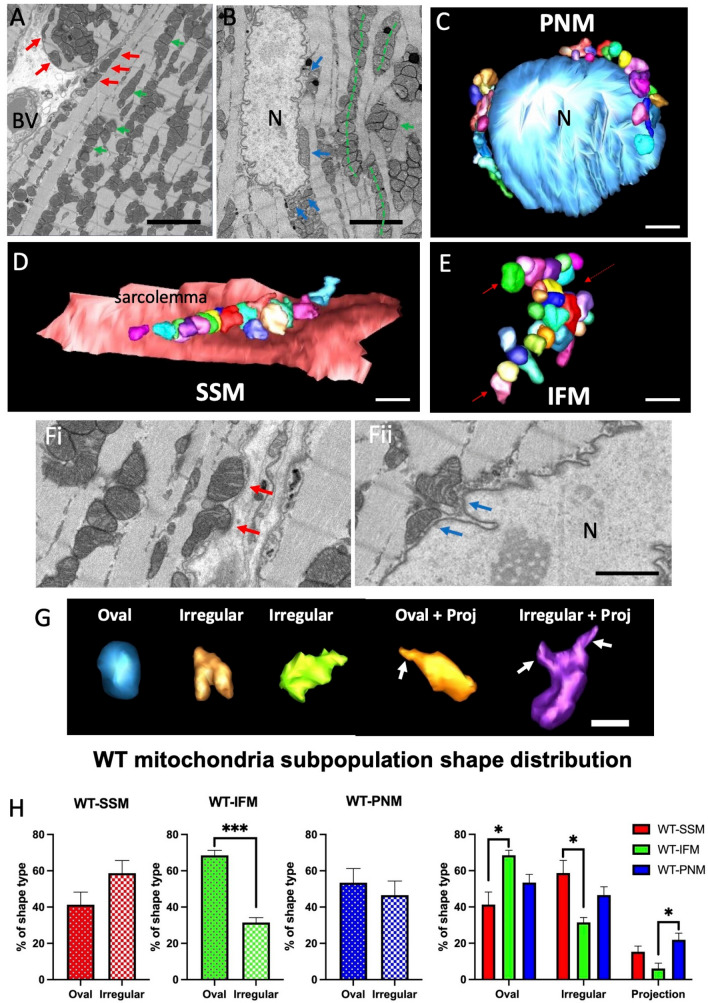
Spatial organisation of mitochondria in the myocardium (apex) of wild-type (WT) mice. (A) Portion of a serial image taken from an SBF-SEM data stack; red arrows indicate SSM, green arrows indicate IFM. BV blood vessel. (B) Area of a serial image showing a cardiomyocyte nucleus (N) with blue arrows indicating PNM. The dashed green lines indicate how IFM form rows of mitochondria. Scale bar = 5 µm. (C) 3-D Segmentation of part of a nucleus (light blue isosurface) and PNMs at the poles of the nucleus either directly in contact or juxtaposed with the nuclear envelope (individual mitochondria are displayed in a range of colours). (D) A cluster of segmented SSM directly adjacent or touching the sarcolemma (pink isosurface). (E) Examples of segmented IFMs showing that rows are also interconnected. Scale bar = 2 µm. (Fi,ii) Indicates how SSM and PNM follow the topography of the adjacent membrane which may explain why their shapes are generally more irregular than PNM. Scale bar = 2 µm. (G) Examples of WT 3-D reconstructed mitochondria and different shapes. Arrows indicate projections. Scale bar = 1 µm. (H) Analysis of the proportion of each shape type (oval, irregular and mitochondria with a tubular projection) within each WT subpopulation. Scale bar = 1 µm.

