Figure 3.
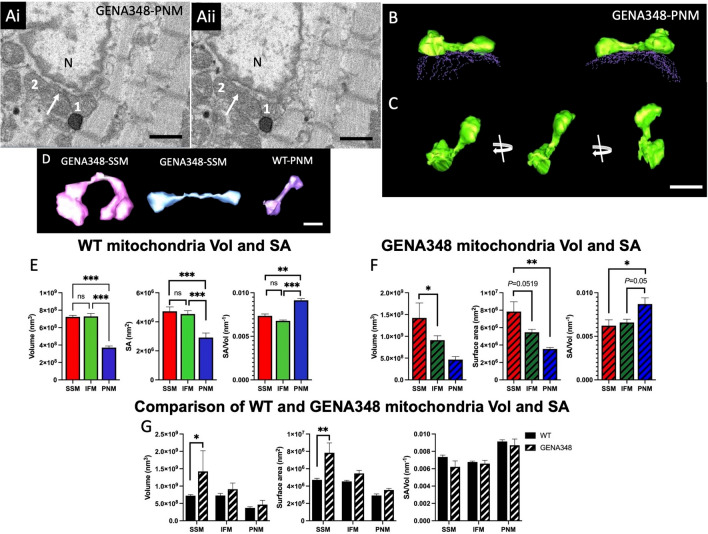
Morphometric analysis of mitochondrial subpopulations in the WT and GENA348 myocardium (apex). (Ai) Portion of a serial image showing two mitochondrion (labelled 1 and 2) adjacent to the nucleus, N. The arrow indicates a small projection extending from mitochondrion 1. (Aii) Shows the same area but several images (100 nm in Z-direction) further into the SBF-SEM stack showing an extension from mitochondrion 2 (white arrow). (B) Segmentation of the two mitochondria labelled 1 and 2 reveals that the projections connect forming a tunnel between the two mitochondria leading to a ‘dumbbell’ shape structure (green isosurface). The nuclear envelope is shown as dashed contours (purple). Portions of each mitochondria and ‘nanotunnel’ are in direct contact with the nucleus. (C) Rotation of the 3-D reconstruction of the nanotunnel showing that the tunnel is approximately 1 µm in length. Scale bar = 1 µm. (D) Examples of 3-D reconstruction nanotunnels identified in the WT and GENA348 mitochondrial populations. Scale bar = 1 µm. (E) Comparison of the WT Vol and SA for each subpopulation determined that PNM are smaller than SSM or IFM, with no difference between SSM and IFM. The SA/Vol ratio of the PNM is greater than SSM or IFM. Mean values (± s.d.) for the WT mitochondrial volumes are; 7.23 ± 0.31 × 10⁸ nm3 (SSM); 7.29 ± 0.59 × 10⁸ nm3 (IFM) and 3.70 ± 0.34 × 10⁸ nm3 (PNM); with a mean SA for each subtype of 4.72 ± 0.31 × 10⁶ nm2 (SSM); 4.54 ± 0.23 × 10⁶ nm2 (IFM); 2.92 ± 0.31 × 10⁶ nm2 (PNM). Data were analysed using a one-way ANOVA (with Tukey’s multiple comparison test) for each mitochondrial subtype from n = 3 animals. *P < 0.05, **P < 0.01, ***P < 0.001. (F) In the GENA348 cardiomyocytes SSM are larger than IFM and PNM (both Vol and SA). Analysis of SA/Vol shows a similar profile to WT mitochondrial subpopulations with PNM having the largest SA/Vol ratio. Mean values (± s.d.) for the GENA348 mitochondrial volumes are; 14.23 ± 3.44 × 10⁸ nm3 (SSM); 9.10 ± 1.02 × 10⁸ nm3 (IFM) and 4.66 ± 1.21 × 10⁸ nm3 (PNM); with a mean SA for each subtype of 7.84 ± 1.13 × 10⁶ nm2 (SSM); 5.46 ± 0.34 × 10⁶ nm2 (IFM); 3.55 ± 0.19 × 10⁶ nm2 (PNM). (G) A comparison of the morphometric parameters show GENA SSM are larger than WT. SA/Vol shows no difference between the WT and GENA348 subpopulations. Data analysed using a two-way ANOVA (Sidaks multiple comparison test). Data presented as mean ± SEM; **P < 0.01, ***P < 0.001, ****P < 0.0001.

