Figure 5.
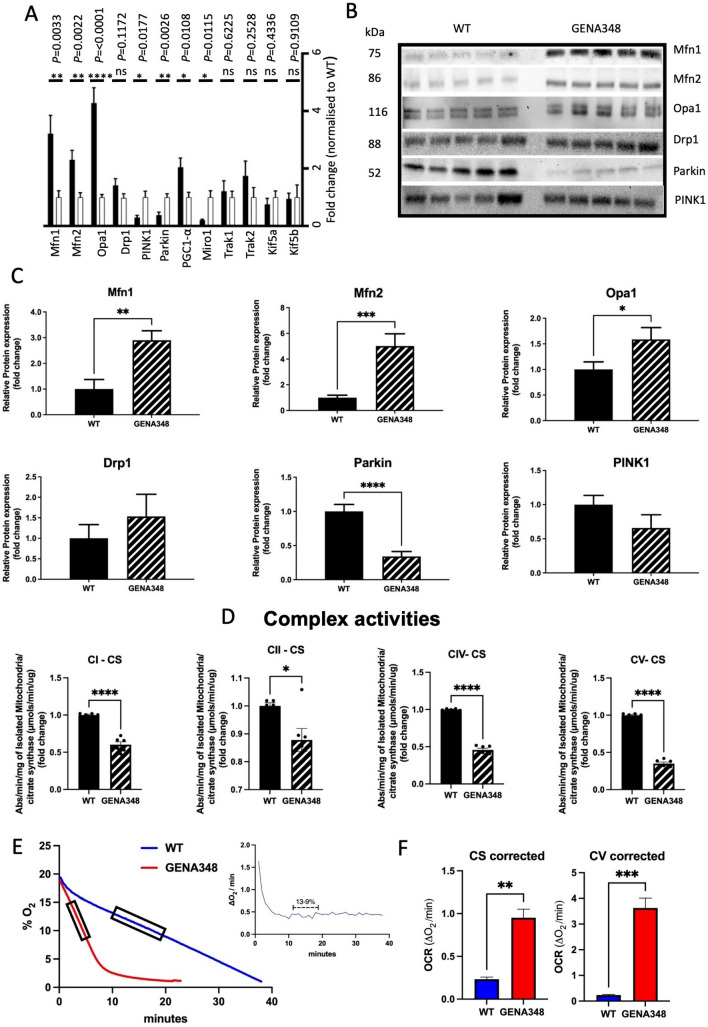
Molecular and functional remodeling of the GENA348 mitochondria compared to WT. (A) qPCR data illustrating fold changes to mRNA levels of proteins regulating mitochondrial dynamics, biogenesis, mitophagy and motility, white bars correspond to WT and black bars GENA348. (B) Western blots of key fusion and fission proteins and mitophagy markers PINK1 and Parkin (a method of total protein was employed for normalization rather than using a housekeeping protein19,57. (C) Western blotting (n = 5 per group) shows there is good agreement for the fission and fusion proteins and Parkin with the qPCR data. (D) Enzymatic assays indicate impaired activity of GENA348 Complexes (n = 5 per group). Data were corrected for citrate synthase activity CI; Complex I; CII, Complex II; CIV, Complex IV; CV, Complex V; (n = 5 per group). (E) Raw data indicating that the OCR is faster in the isolated GENA348 mitochondria. Rates were calculated in regions of steady state as shown in the inset and as previously described29 for each preparation. (F) Left; OCR data normalised to citrate synthase (CS) activity. Right; OCR data normalised to uncorrected Complex V (CV) activity relative to WT; both methods show that the OCR is faster in the GENA348 myocardium compared to WT. All data is presented as mean ± SEM; two-tailed unpaired Student t test; *P < 0.05, **P < 0.01, ***P < 0.001 and ****P < 0.0001.

