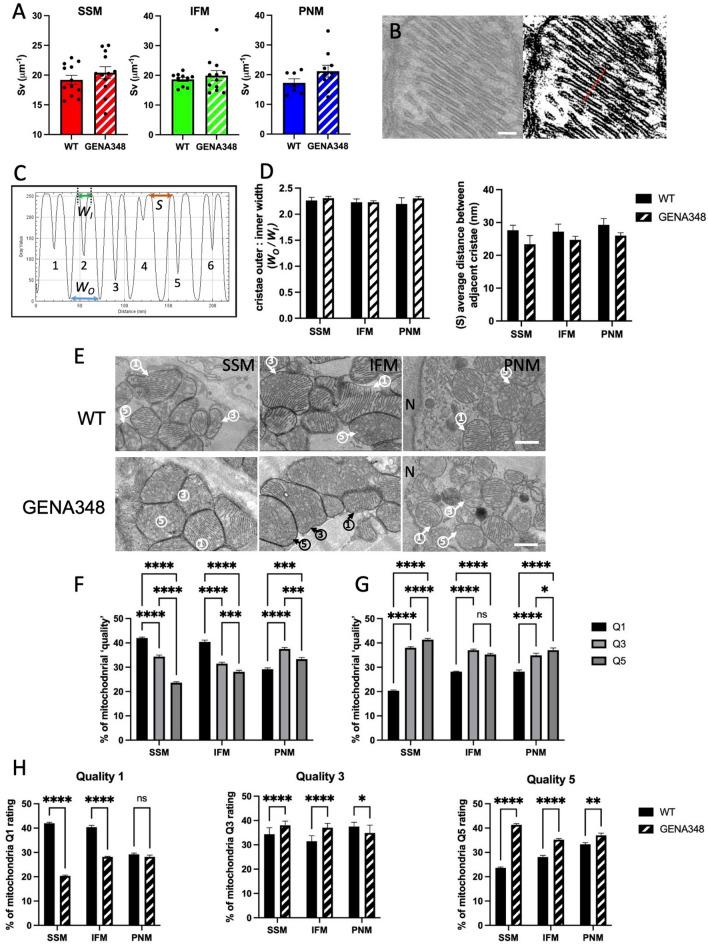
Figure 6.
Comparison of cristae density and dimensions in each of the mitochondrial subpopulations using TEM images of thin sections of the WT and GENA348 myocardium. (A) There is no difference between the cristae density within the mitochondrial subpopulations. Each data point represents the mean of the cristae density for a mitochondrial subpopulation in each TEM image analysed. (B) Left: Example of a mitochondrion with ordered cristae (WT) used to analyse cristae dimensions. Right: The same mitochondrion after applying the (ImageJ) threshold function. Scale bar = 100 nm. The red line illustrates the position of the ‘line plot’ which spans 6 cristae. (C) Density analysis of the line spanning the cristae highlighted in (B) using ‘plot line’ function (ImageJ), each cristae is labelled 1–6. Each crista has a characteristic doublet representing the outer and inner membrane surface. Parameters measured were WO, the distance between the outer membrane leaflet; WI, the distance between the cristae inner membrane (lumen) and S, the distance between adjacent crista. (D) There is no difference between the WT and GENA348 cristae widths (WO/WI) or spacing (S); (see Table 2 for dimensions). (E) Examples of mitochondria in WT and GENA348 micrographs assigned according to ‘quality’; 1 = mitochondria has ordered cristae; 3 = mitochondria with areas of partial cristae organization; 5 = no visible cristae. N nucleus. (F) WT SSM and IFM mitochondrial subpopulations have a greater percentage of type 1 mitochondria with ordered cristae. (G) GENA348 SSM and PNM have more mitochondria with only partially ordered cristae and mitochondria without defined cristae. (H) A comparison of the ‘quality’ scoring between WT and GENA348 subpopulations shows that there are less ‘type 1’ mitochondria with more ‘type 3 and 5’ in the GENA348 SSM and IFM compared to WT. All data is presented as mean ± SEM. Data were analysed using a one-way ANOVA (with Tukey’s multiple comparison test) n = 3 animals per group.

