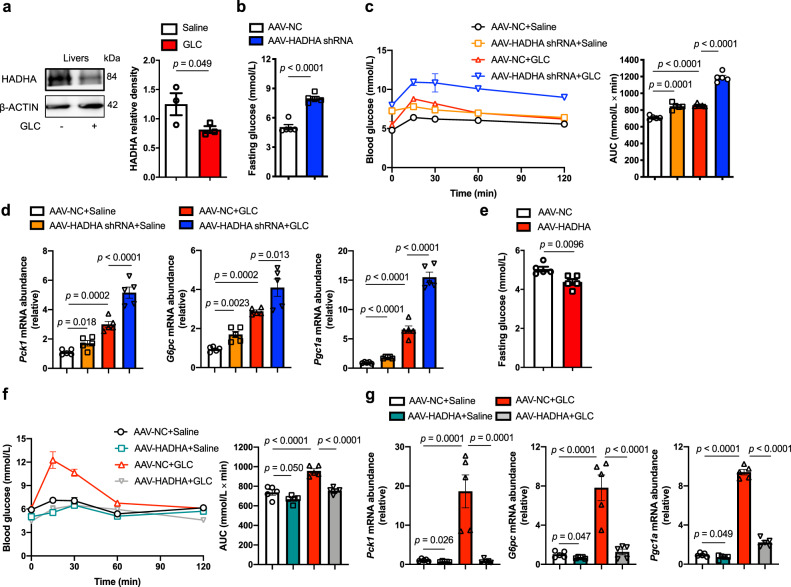
Fig. 1. HADHA inhibited glucagon-stimulated hepatic gluconeogenesis.
a Hepatic HADHA protein level in glucagon-challenged mice (2 mg/kg, n = 3). b Fasting blood glucose of liver-specific HADHA knockdown mice (n = 5). c Blood glucose levels in normal mice subjected to glucagon challenge (2 mg/kg) and treated with AAV8-HADHA shRNA or AAV8-NC. AUC is indicated on the right (n = 5). d mRNA levels of Pck1, G6pc and Pgc1a in the livers of the mice in c (n = 5). e Fasting blood glucose of liver-specific HADHA-overexpressed mice (n = 5). f Blood glucose curve and AUC for mice treated with AAV8-HADHA or AAV8-NC after glucagon injection (2 mg/kg, n = 5). g mRNA levels of Pck1, G6pc and Pgc1a in the livers of the mice in f (n = 5). AAV adeno-associated virus, AUC area under the curve, GLC glucagon, NC normal control. Bars represent mean ± SEM values. Statistical differences between two groups were determined by a two-tailed Student’s t test, and all others were used by one-way ANOVA. Source data are provided as a Source Data file.

