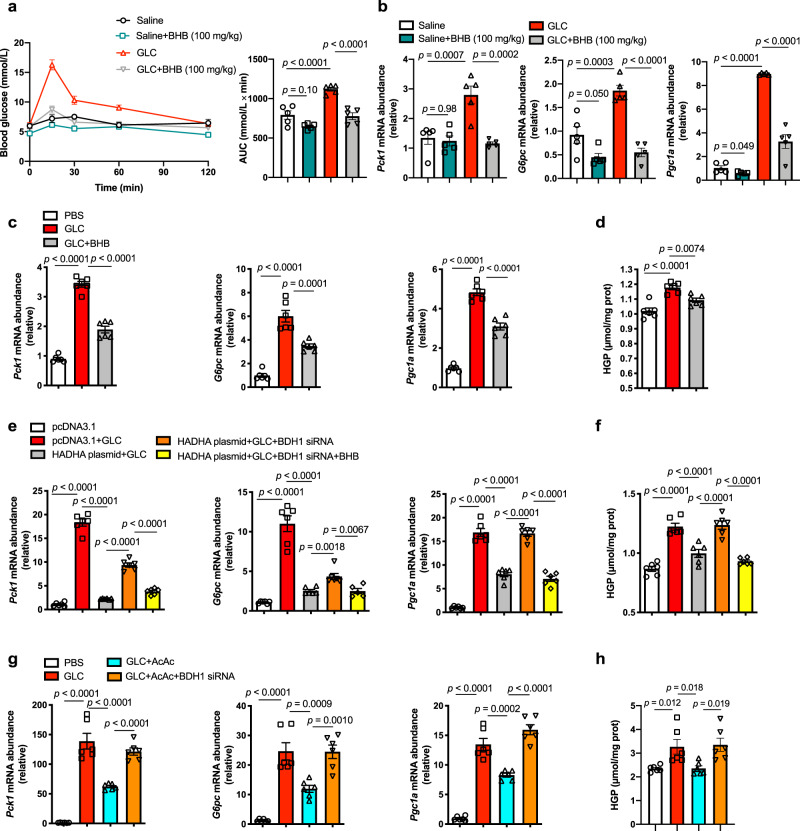
Fig. 3. BHB was responsible for the inhibitory effect of HADHA on hepatic gluconeogenesis.
a Blood glucose levels in normal mice subjected to glucagon challenge (2 mg/kg) and those with BHB treatment (100 mg/kg). AUC is indicated on the right (n = 5). b mRNA levels of Pck1, G6pc and Pgc1a in the livers of the mice in a (n = 5). c mRNA abundance of Pck1, G6pc and Pgc1a in glucagon-stimulated (100 nM, 1 h) primary hepatocytes treated with or without BHB (400 μM, 6 h, n = 5). d HGP from the hepatocytes in c (n = 6). e Relative mRNA abundance of Pck1, G6pc and Pgc1a in HADHA-overexpressed primary hepatocytes transfected BDH1 siRNA with or without BHB pretreatment (400 μM, 6 h), 100 nM glucagon stimulation for 1 h (n = 6). f HGP from the hepatocytes in panel e (n = 6). g Relative mRNA abundance of Pck1, G6pc and Pgc1a in AcAc pretreated (400 μM) primary hepatocytes with or without BDH1 siRNA transfection (n = 6). h HGP from the hepatocytes in g (n = 6). AcAc acetoacetate, AUC area under the curve, BHB β-hydroxybutyrate, GLC glucagon, HGP hepatic glucose production, PBS phosphate buffer saline. Values represent mean ± SEM. Statistical differences were determined by one-way ANOVA. Source data are provided as a Source Data file.

