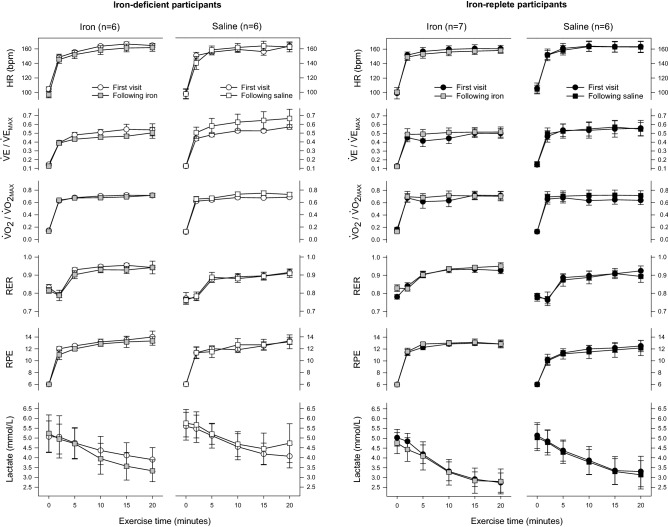
Figure 3.
Cardiorespiratory variables during submaximal exercise at each study visit. Data for ID participants appear as white symbols; those for IR participants, black symbols. Data from the first visit appear as circles; those for the second, squares. Data for the second visit in participants receiving IV iron are shown in grey. E and o2 values for both visits are expressed relative to maximal values at the first visit. Values for parameters other than lactate are means for the previous 30 s; error bars show SE. One ID participant became presyncopal after volitional fatigue at the second visit and did not perform submaximal exercise; data for this individual are excluded from the figure (but not the statistical analysis). Data at the first visit for E, o2 and RER at the 10, 15 and 20-min time points were missing for one IR participant randomised to receive saline due to a technical issue. P = 0.028 for differential effect of IV iron according to baseline iron status; comparisons for all other variables NS. HR, heart rate; E, minute ventilation; RER, respiratory exchange ratio; RPE, rating of perceived exertion.

