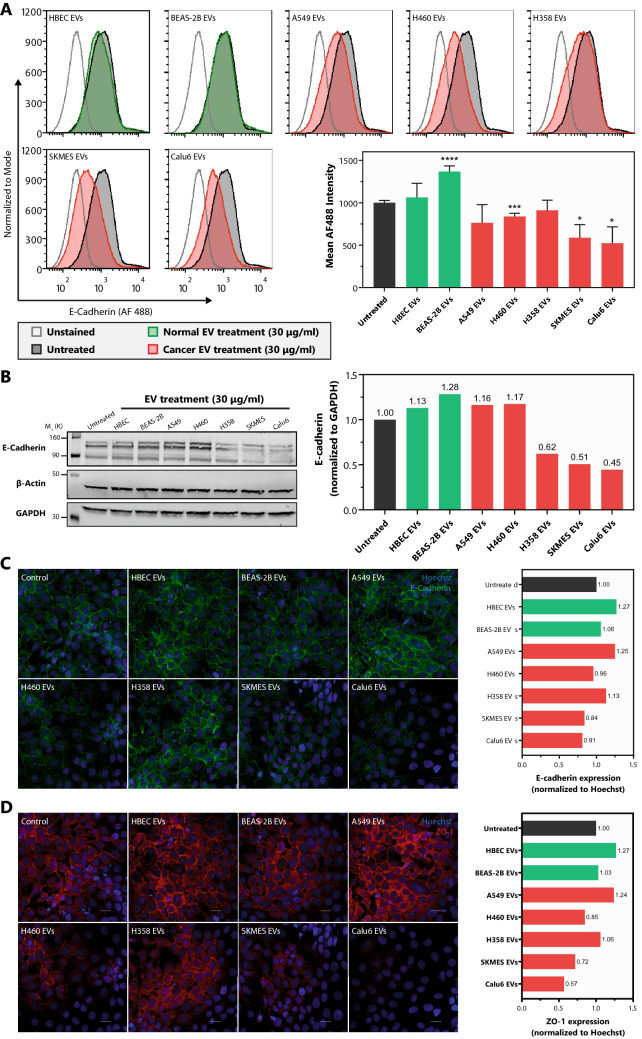
Figure 4.
Varied potential of NSCLC EVs to modulate the expression of junctional complex proteins E-cadherin and ZO-1. (A) Representative histograms demonstrating the levels of surface E-cadherin on BEAS-2B cells treated with non-tumorigenic or cancer cell derived EVs for 48 h. The bar graph shows quantified data from independent repeats (n = 3). p values were computed using unpaired t-test with Welch’s correction. (B) Representative western blot showing cellular (surface + intercellular) E-cadherin levels in BEAS-2B cells treated with non-tumorigenic or cancer cell derived EVs for 96 h (Following transfer, membranes were cut, incubated in respective antibodies, and were imaged using the Licor. Cut, uncropped blots, depicting the full region scanned on the Licor can be found in Supplementary Information Fig. S5). Quantification is depicted in the bar graph. Confocal microscopy analysis of (C) E-cadherin and (D) ZO-1 levels at the intercellular junctional complexes in BEAS-2B cells treated with non-tumorigenic or cancer cell derived EVs for 48 h (size bar – 20 μm). The relative levels from the representative images are normalized to Hoechst stain with the quantification shown on the right for each respective protein. *p < 0.05, **p < 0.01, ***p < 0.001 and ****p < 0.00001.

