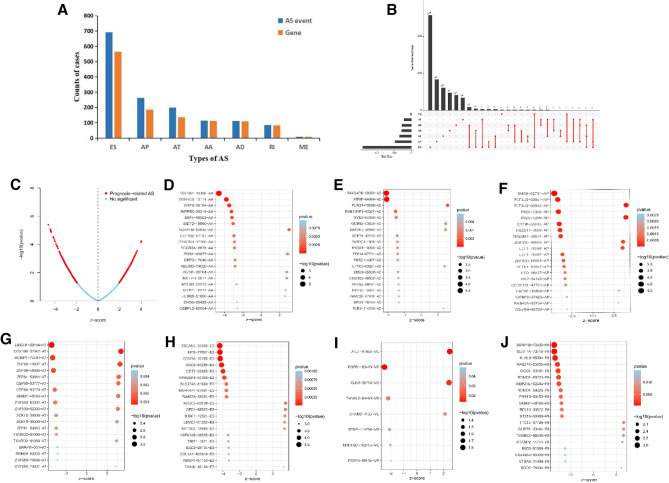
Figure 2.
Top 20 significant AS events of OC. (A) Counts of survival-associated AS events and correlated genes. (B) Upset plot of interactions diagram of survival-associated AS events. (C) The volcano plot of survival-related AS events (red dots). Red dots indicate survival-related AS events in OC. Blue dots indicate AS events unrelated to survival in OC. Bubble plots of the top 20 survival-related AS events based on AA (D), AD (E), AP (F), AT (G), ES (H), ME (I), and RI (J), respectively.

