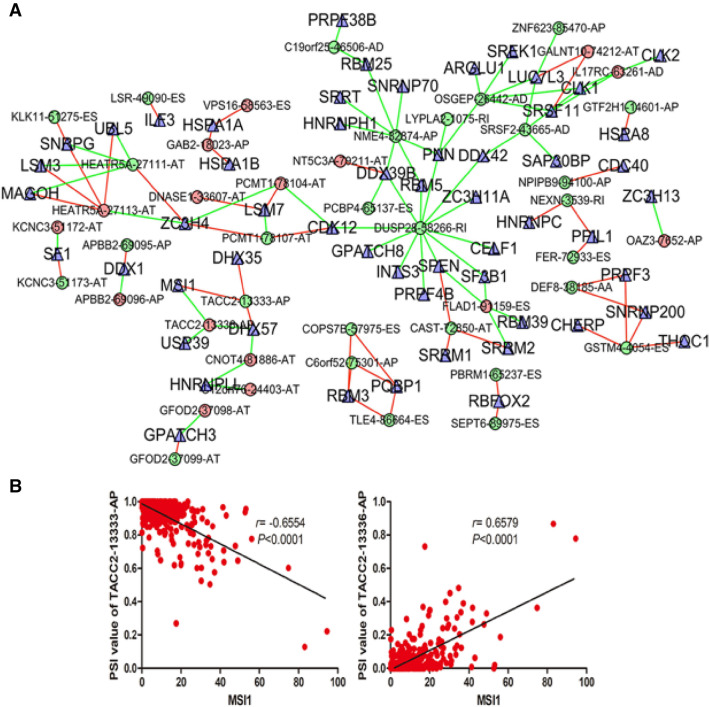
Figure 8.
The interaction network and correlation between SFs and AS events. (A) The red dots indicate down-regulation, and the green dots indicate up-regulation. The blue triangles indicate SFs. The green lines represent AS events, which were positively correlated with the expressions of SFs, while red lines indicate negative correlations. (B) The correlation analysis was performed using Pearson t test. MSI1 could positively regulate -13336-AP (r = 0.6579, P < 0.0001) and negatively
regulate TACC2TACC2-13333-AP (r = − 0.6554, P < 0.0001).

