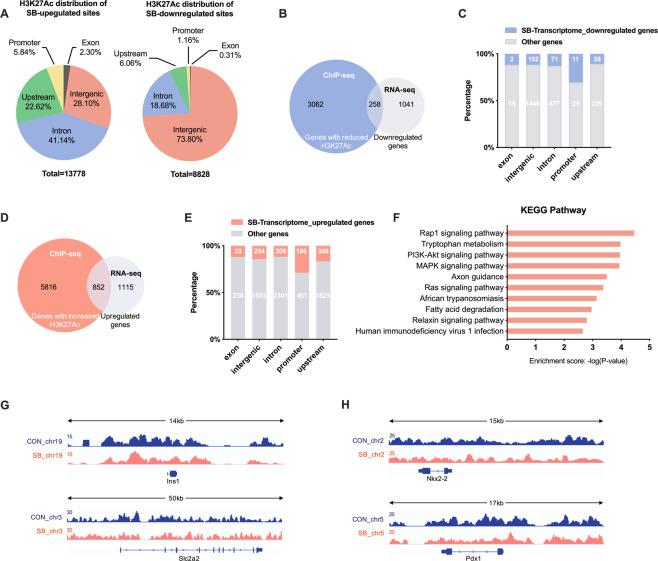
Fig. 3. Role of H3K27Ac in sodium butyrate-induced changes of gene expressions shown by ChIP-seq analysis.
A Genomic distribution of H3K27Ac enriched peaks regulated by sodium butyrate (SB) (fold change > 2.0, p-value < 0.001). B Venn diagram of the overlap between annotated genes with downregulated H3K27Ac occupation and downregulated genes identified in RNA-seq. C Genomic distribution of both H3K27Ac enriched peaks and corresponding genes downregulated by SB (blue). D Venn diagram of the overlap between annotated genes with upregulated H3K27Ac occupation and upregulated genes identified in RNA-seq. E Genomic distribution of both H3K27Ac enriched peaks and corresponding genes upregulated by SB (orange). F KEGG pathway analysis on the overlapping upregulated genes by SB at mRNA level and H3K27Ac level in their promoter. G, H Detailed H3K27Ac patterns of Ins1, Slc2a2, Nkx2-2, and Pdx1 from ChIP-Seq. Gene structure and chromosomal location are shown.

