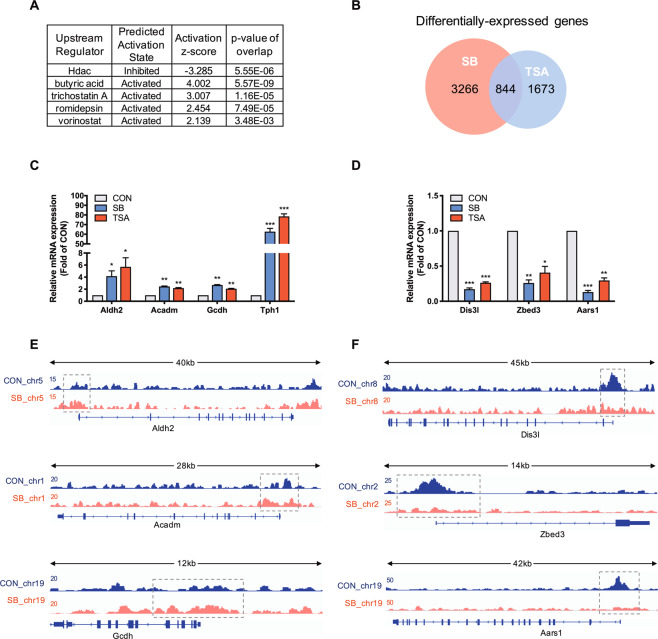
Fig. 4. Comparative analysis of the gene expression profiles from sodium butyrate- and trichostatin A-treated rat islets.
A Upstream regulator analysis of Ingenuity Pathway Analysis (IPA) on sodium butyrate (SB)-regulated genes. B Overlapping differentially expressed genes in rat islets regulated by both SB and trichostatin A (TSA). C, D RT-qPCR analysis of commonly upregulated and downregulated genes in rat islets by 5 mM SB and 200 nM TSA. E H3K27Ac patterns of Aldh2, Acadm, and Gcdh from ChIP-seq. Gene structure and chromosomal location are shown, with the gray dotted box highlighting the upregulated peaks in their promoter regions by SB. F H3K27Ac patterns of Dis3l, Zbed3, and Aars1 from ChIP-Seq. Gene structure and chromosomal location are shown, with the gray dotted box highlighting the downregulated peaks in their promoter regions by SB. Data were given as mean ± SD for three separate experiments. *p < 0.05, **p < 0.01, ***p < 0.001 vs control (CON) group.

