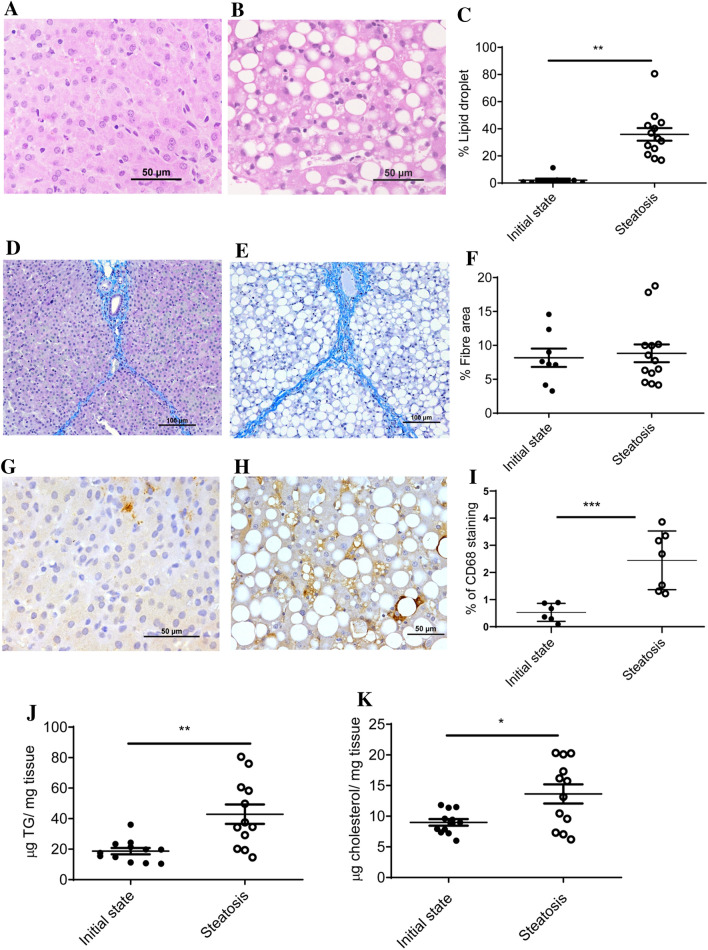
Figure 1.
Characterization of liver in a porcine model of dietary NAFLD development. Representative liver micrographs, stained with haematoxylin–eosin, from commercial bred swine before (A) and after (B) consuming the steatotic diet for 2 months. Morphometric changes in lipid droplet area expressed as percentage of total liver section (C). Representative liver micrographs before consuming (D) and after consuming the steatotic diet for 2 months (E) using Masson’s trichrome staining. Morphometric changes in fibre area (F), expressed as percentage of total liver section. Representative CD68 immunostaining from liver sections coming from pigs before consuming (G) and after consuming the steatotic diet for 2 months (H). Morphometric changes in CD68 positive areas (I), expressed as percentage of total liver section. Hepatic triglyceride (J) and cholesterol (K) contents before and after consuming the steatotic diet for 2 months. Individual values, means and SD are represented for each group. Statistical analyses were carried out using Mann–Whitney U test. *p < 0.05; **p < 0.01.

