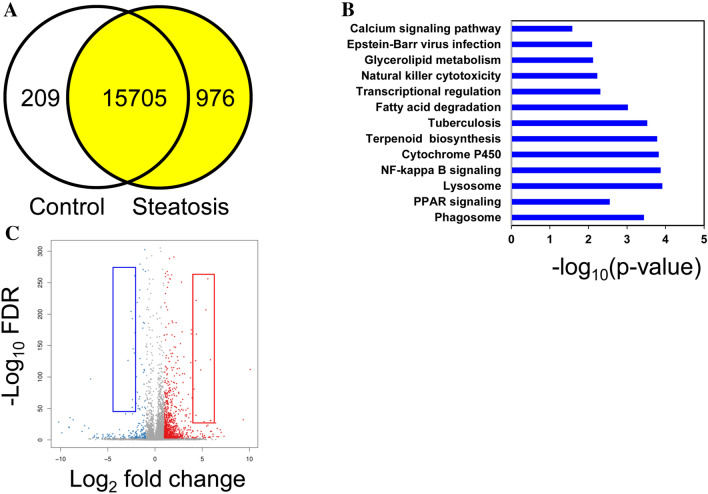
Figure 2.
Differentially expressed genes according to RNAseq from livers in a porcine model of dietary NAFLD development. (A), Venn diagram analysis showing the transcripts expressed in control (initial state) and steatotic groups (the same animals on the steatotic diet for 2 months) with fold change > 2 and false discovery rate < 0.01. (B), Pathway enrichment of differentially expressed genes expressed as the log [–P] analysed by KEGG pathway enrichment. (C), Volcano plot representing initial vs. steatotic state differentially expressed genes. Red and blue squares represent the selected genes shown in Supplementary Table S5.

