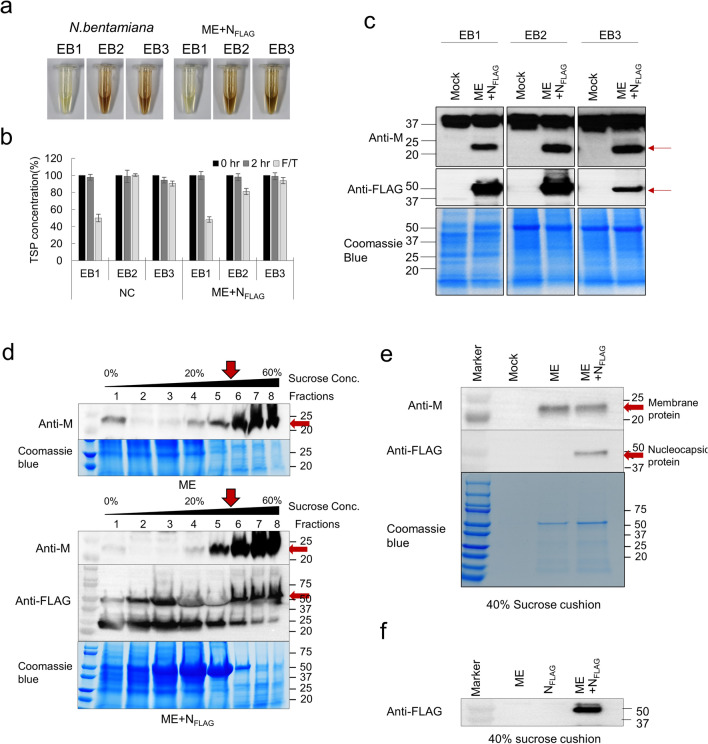
Figure 2.
(a–c) Effect of TSP extraction by protein extraction buffer. Comparison of solution states (a) and TSP concentrations (b) extracted from infiltrated leaves using three protein extraction buffers EB1 (PBS, EDTA, and 2-mercaptoethanol), EB2 (PBS and EDTA), and EB3 (only PBS). The TSP concentration was measured 2 h after extraction (2 h) or the sample thawed after freezing (F/T). Values are the means ± SE of three independent biological replicates. (c) Western blot analysis of M protein (25 kDa) and N protein (46 kDa) expression in TSP extracted by three extraction buffers. (d) The purification conditions of plant-derived VLPs were confirmed through 10–60% sucrose gradient sedimentation of ME and ME + NFLAG TSP. M protein and N protein were observed in about 40% sucrose layer by western blot analysis with M and FLAG antibodies. (e) Identification of M and N proteins from VLPs purified by 40% sucrose cushion in TSP of ME and ME + NFLAG. (f) Presence of N protein after purification of VLPs using 40% sucrose in NFLAG single expression and ME + NFLAG co-expression. All images were cropped. See Supplementary Figs. S4–S7 for full size of blot.

