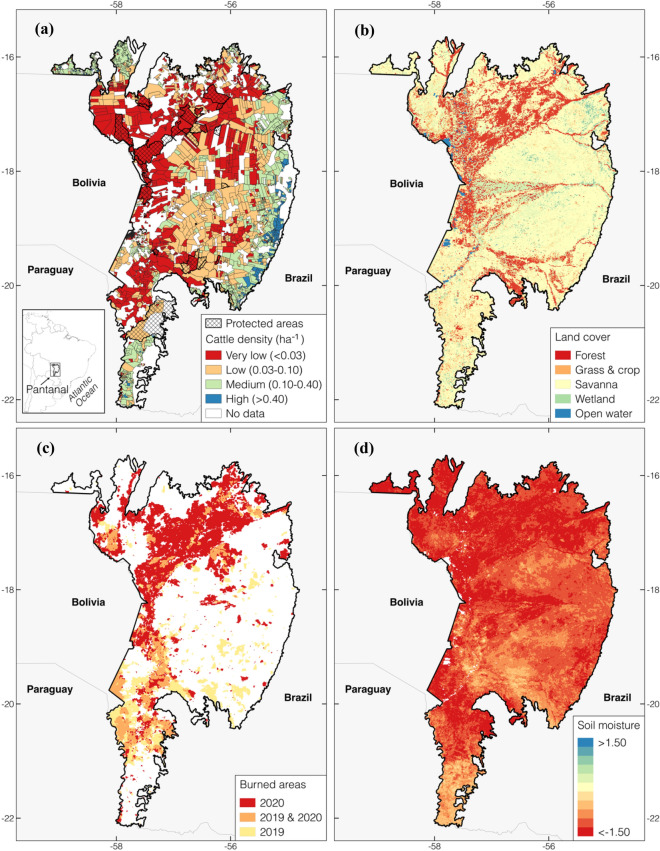
Figure 1.
Map of the study domain over the Pantanal: (a) shows four categories of pasture based on cattle head density per cattle ranch (estimated from the Mapbiomas project37), with the conservation areas (shown in the hatched patterns) with the indigenous and environmental reserves (http://www.funai.gov.br/index.php/shape; https://antigo.mma.gov.br/areas-protegidas/cadastro-nacional-de-ucs/dados-georreferenciados.html), (b) shows the four dominant land cover types from the MODIS land cover data67, (c) shows the locations of the burned areas in 2019 and 2020, based on the MCD64A1 burned area product43, and (d) shows a map of the standardized 6-month root zone soil moisture anomaly averaged across the Aug-Nov of 2020. The spatial maps are created using QGIS (https://qgis.org/en/site/).

