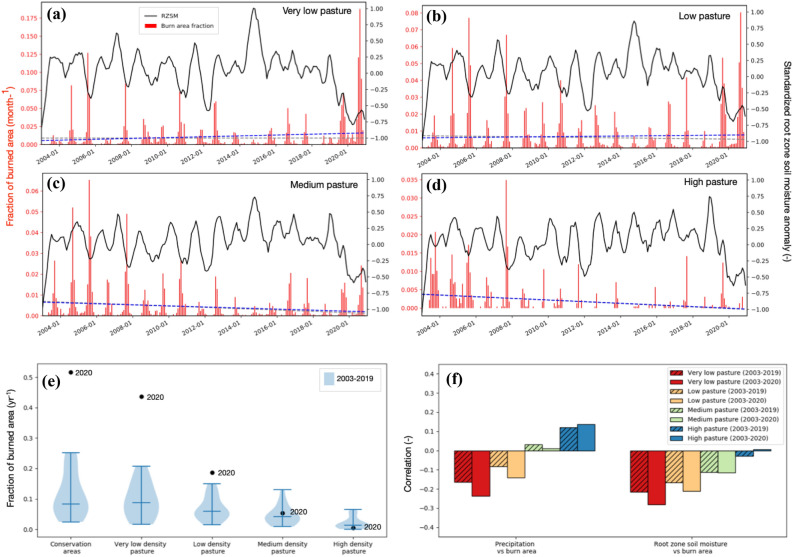
Figure 2.
Time series of the standardized anomalies of antecedent 6-month root zone soil moisture (black lines) and fraction of burned areas per month (red bars) over areas with different pasture density (panels a, b, c, d). The dashed blue and gray lines show the linear trend of the monthly fraction of burned area (Table 1) over the 2003–2020 and 2003–2019 time periods, respectively. Panel e shows the distribution of annual fraction of burned area across 2003–2019 and from 2020 and Panel f shows the Spearman correlation between the standardized anomalies in variables relevant for fuel moisture (i.e., 12-month precipitation, 6-month root zone soil moisture) and percent of burn area, stratified for areas with four different levels of pasture density.

