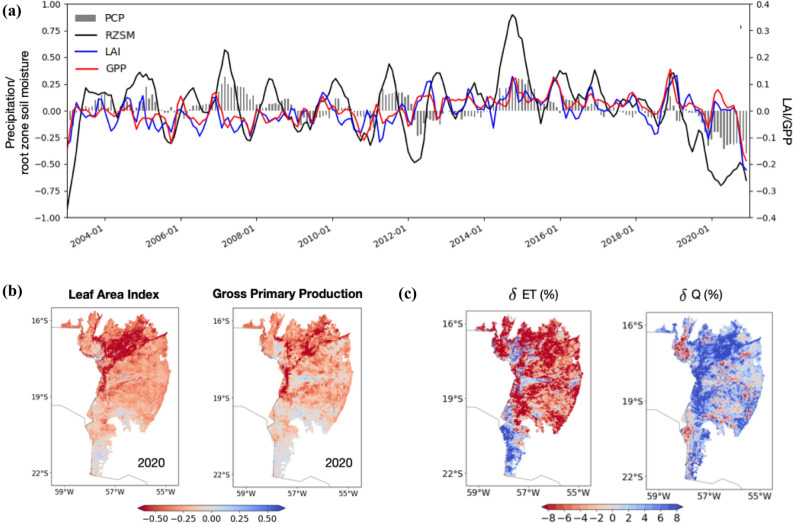
Figure 3.
Time series (Panel a) of domain averaged standardized anomalies of 12-month precipitation, 6-month root zone soil moisture (RZSM), 2-month Leaf Area Index (LAI), and 2-month Gross Primary Production (GPP). The bottom panel b shows the ecosystem impacts of the 2020 fire events, with spatial maps of standardized anomalies in 2-month LAI, and 2-month GPP, averaged during Sep-Nov for 2020. Panel c shows impacts of fires on the local hydrology over the Pantanal. The percentage change in evapotranspiration (ET) and runoff (Q) during the post-fire time period, relative to a scenario where climatological average vegetation conditions are present. The spatial maps in Panels b and c are created using matplotlib (https://matplotlib.org/).

