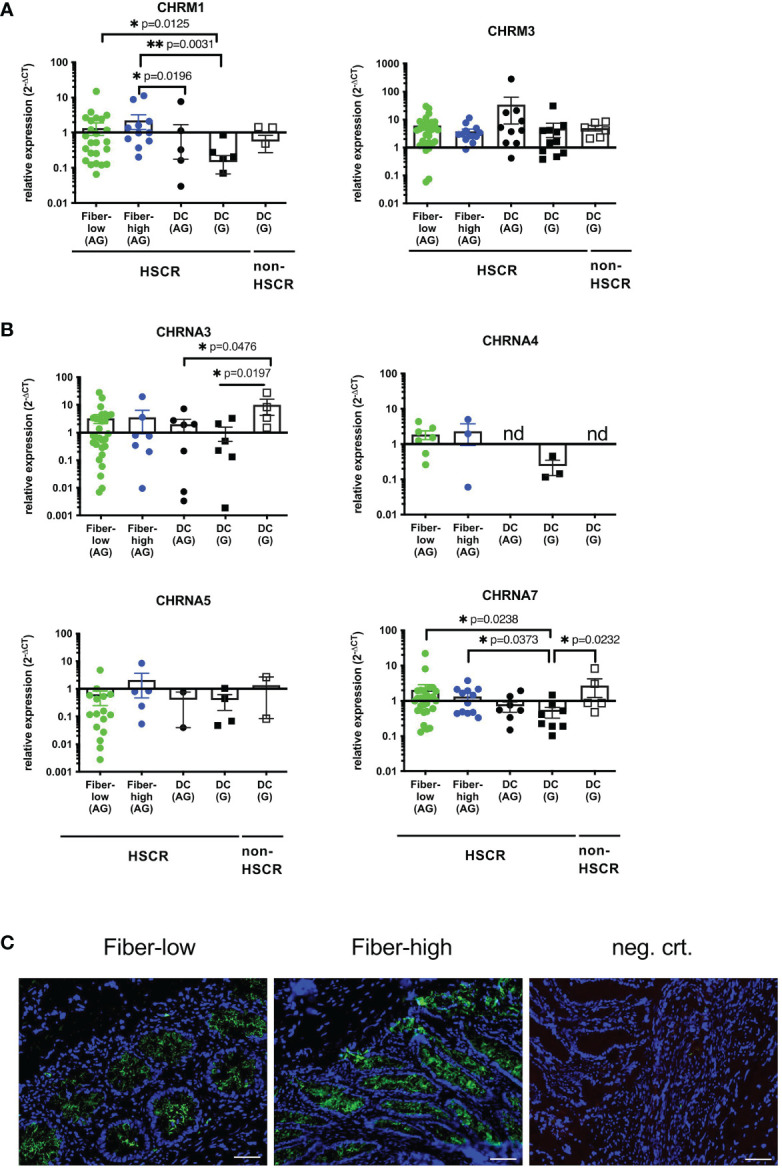
Figure 4.

Expression of IEC-specific cholinergic receptors. Purified epithelial cells were immediately lysed, total RNA isolated and cDNA synthesized. Relative gene expression was calculated using the 2-ΔCT method, with β2-microglobulin as the housekeeping gene (A, B). Scatter plots with bar show mean ± SEM. Significance was determined using the Kruskal-Wallis test (*p ≤ 0.05, **p ≤ 0.01). Fiber-low (n=30); Fiber-high (n=13); DC AG (n=10); DC G, HSCR (n=12); DC G, non-HSCR (n=6). Not detectable samples: Fiber-low: CHRM1 (n=1); CHRNA3 (n=2); CHRNA4 (n=23); CHRNA5 (n=14); CHRNA7 (n=2). Fiber-high: CHRNA3 (n=6); CHRNA4 (n=10); CHRNA5 (n=8); CHRNA7 (n=1). DC AG: CHRNA3 (n=3); CHRNA4 (n=10); CHRNA5 (n=8); CHRNA7 (n=2). DC G, HSCR: CHRM1 (n=1); CHRM3 (n=1); CHRNA3 (n=6); CHRNA4 (n=9); CHRNA5 (n=8); CHRNA7 (n=4). DC G, non-HSCR: CHRNA3 (n=2); CHRNA4 (n=6); CHRNA5 (n=4); CHRNA7 (n=1). nd: not detectable. CHRNA7 Immunofluorescence (5µm cryosections) from fiber-low and fiber-high rectosigmoid using purified mouse IgG1 anti-alpha7nAchR antibody (green) (C). DAPI (blue) shows cell nuclei. Secondary antibody goat anti-mouse IgG1 Alexa 555 was used as the negative control. Scale bar 50µm.
