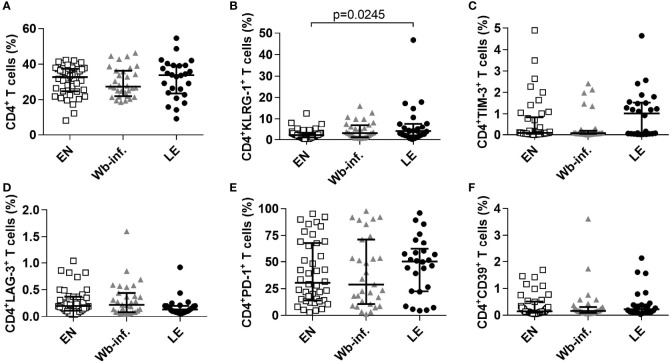
Figure 1.
Elevated frequencies of exhausted CD4+ T cell subsets in filarial LE patients. Frequencies of CD4+ T cells were measured by flow cytometry in PBMCs from cohorts of healthy endemic normal subjects (EN, n=44), Wuchereria bancrofti-infected (Wb-inf., n=31) and lymphedema patients (LE, n=26). (A) Cell populations were analyzed according to the applied gating strategy ( Supplementary Figure S1 ) to decipher frequencies of (A) CD4+, (B) CD4+KLRG1+, (C) CD4+TIM-3+, (D) CD4+LAG-3+, (E) CD4+PD-1+ and (F) CD4+CD39+ T cell subsets. Symbols in graphs show individual data sets with median and interquartile range. Statistical significance between the groups was obtained using Kruskal-Wallis followed by Dunn’s multiple comparison post hoc analysis.

