Figure 2.
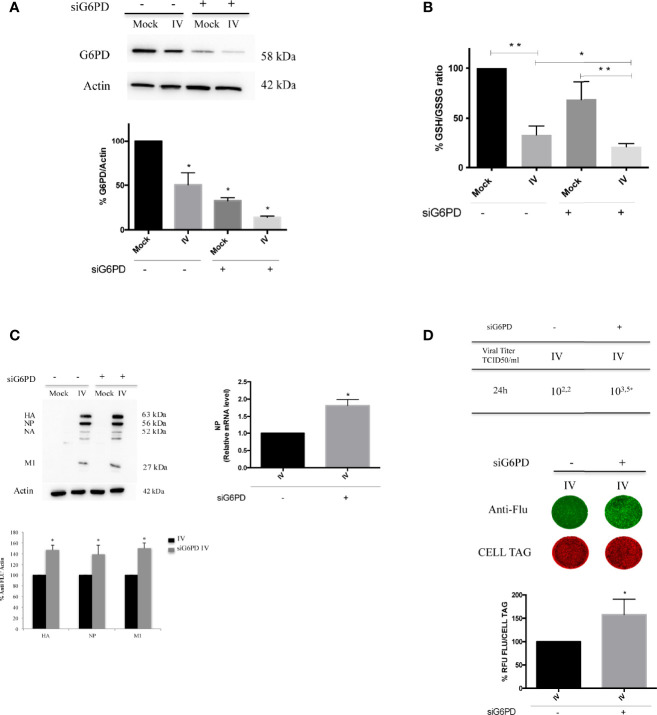
G6PD knockdown in infected cells exacerbates the virus-induced oxidative stress and influenza virus replication. (A) Western blot analysis of G6PD protein expression in A549 mock-infected control cells (Mock) and PR8-infected cells (IV) transfected with siRNA specific to G6PD (siG6PD) or with a control non-targeting siRNA (*P < 0.05 vs. Mock control cells). (B) Intracellular GSH/GSSG ratio measured after 24 h from infection by a colorimetric assay as described in methods and represented as percentage (%) respect to mock-infected control siRNA cells (considered 100%). The graph represents the mean ± S.D. obtained from three separate experiments, each performed in duplicate (n = 6) (*P < 0.05 IVs i vs. IV; **P < 0.001 I vs. Mock and IVsi vs. Mocksi ). (C) Western blot analysis of viral proteins: HA, Hemagglutinin; NP, Nucleoprotein; NA, Neuraminidase; M1, Matrix 1. The densitometry analysis was performed on three viral proteins normalized to Actin. Results are the mean ± S.D. obtained from three independent experiments, each performed in duplicate (n = 6) (*P < 0.05 vs. IV). In the right panel is represented the analysis of NP mRNA expression by RT-qPCR in infected control or silenced cells. Data are expressed as mean ± S.D, obtained from two independent experiments (*P < 0.05 vs. IV). (D) Viral load released in the supernatants of IV and IVsi A549 cells measured by TCID50 assay (*P < 0.05) (upper panel). Results are representative of one experiment of the three performed. In the bottom panel, ICW assay of the same supernatants. The images show viral proteins expression (green fluorescence) stained with anti-influenza antibody and cell monolayer (red fluorescence, CELL TAG). The graph shows the percentage (%) of RFU obtained from viral proteins normalized to CELL TAG of IVsi cells compared to IV (considered as 100%). The analysis was performed measuring the RFU values of 4 different fields/well for each condition from the three experiments performed. Data are expressed as mean ± S.D (*P < 0.05 vs. IV).

