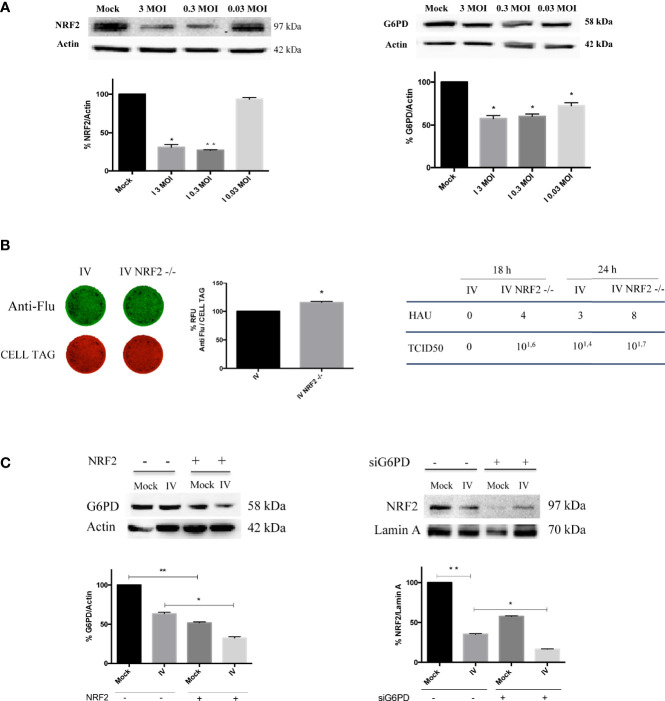
Figure 3.
Downregulation of NRF2-mediated antioxidant response improves influenza virus infection. (A) Western blot analysis of NRF2 and G6PD protein expression in A549 cells infected with different MOI (3, 0.3 and 0.03) of PR8 for 24 h. Actin was used as loading control. Data are the mean ± S.D. of two independent experiments, each condition run in duplicate (n = 4) (*P < 0.05 and **P < 0.001 vs. Mock). (B) ICW of viral proteins expression in A549 wild-type (IV) and A549 NRF2 -/- cells (IV NRF2 -/-) (left panel). The images show viral proteins expression (green fluorescence, anti-Flu) and cell monolayer (red fluorescence, CELL TAG). The graph represents the percentage (%) of RFU obtained from viral proteins normalized to CELL TAG. The analysis was performed measuring the RFU values of 4 different fields/well for each condition from the three experiments performed. Data are expressed as mean ± S.D. (*P < 0.05 vs. IV). Viral titer measured in the supernatants of A549 wild-type (IV) and A549 NRF2 -/- cells (IV NRF2 -/-) by Hemagglutination (HAU) and TCID50 assays (right panel). (C) Western blot analysis of G6PD expression in NRF2 -/- or wild type A549 cells infected with PR8 virus (IV conditions) for 24 h. Densitometry analysis of data obtained from two experiments performed; the values are expressed as mean ± S.D. (**P < 0.001, Mock vs. Mock -/-; *P < 0.05, IV vs. IV -/-). In the right panel is represented the analysis of NRF2 protein expression in the nuclear extracts of silenced G6PD or normal cells infected or not with PR8 virus (IV), left panel. Lamin was used as loading control. Densitometry analysis of data obtained from the two experiments performed; the values are expressed as mean ± S.D. (**P < 0.001, IV vs. Mock; *P < 0.05, IVsi vs. IV).

