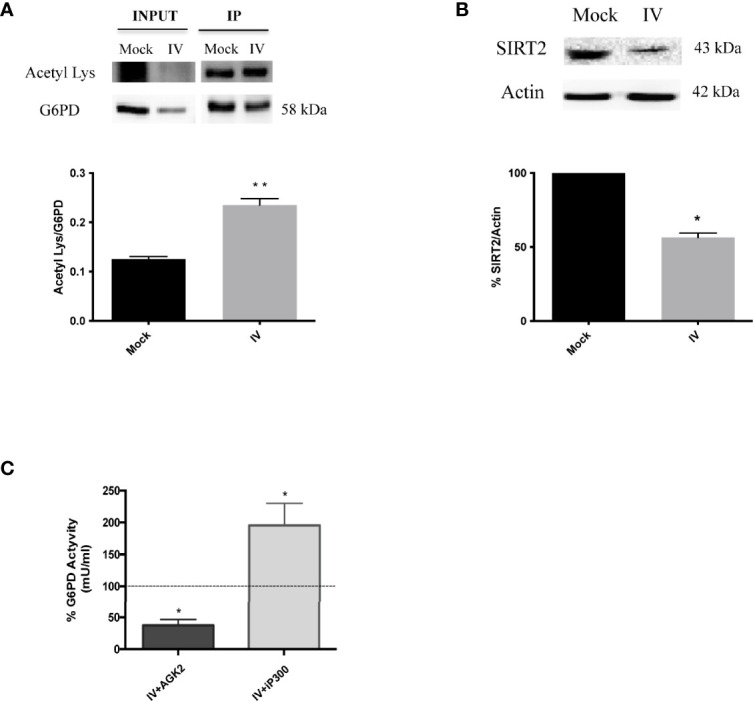
Figure 5.

G6PD is more acetylated after the infection and it correlates with a downmodulation of SIRT2 deacetylase. (A) Immunoprecipitation assay of G6PD protein in mock-infected control (Mock) and PR8 virus-infected A549 cells (IV) 24 h p.i. Blot is representative of two independent experiments and shows the G6PD expression of total cell lysate (INPUT) and in the immunoprecipitated (IP) samples. Densitometry analysis in the graph shows the ratio of Acetylated Lysine on the immunoprecipitated protein (Acetyl Lys/G6PD) of two independent experiments performed in duplicate (n = 4). Data are the mean ± SD (**P < 0.001 vs. Mock). (B) Western blot analysis of SIRT2 protein expression in A549 cells infected with PR8 virus for 24 h. The graphs represent the densitometry analysis of SIRT2 protein expression. Actin was used as loading control for the analysis of three experimental replicates (n = 3). Data are the mean ± SD (*P < 0.05 vs. Mock). (C) G6PD activity in A549 infected cells treated with AGK2 inhibitor (IV+AGK2) or with iP300 (IV+iP300). The values were normalized with those of the standard NADH curve as described in materials and methods. G6PD activity is expressed as percentage (%) with respect to that obtained from untreated-infected cells which is indicated by the dashed black line (considered as 100%). Data are represented as mean ± S.D. obtained from three experiments performed (*P < 0.05 vs. IV untreated cells).
