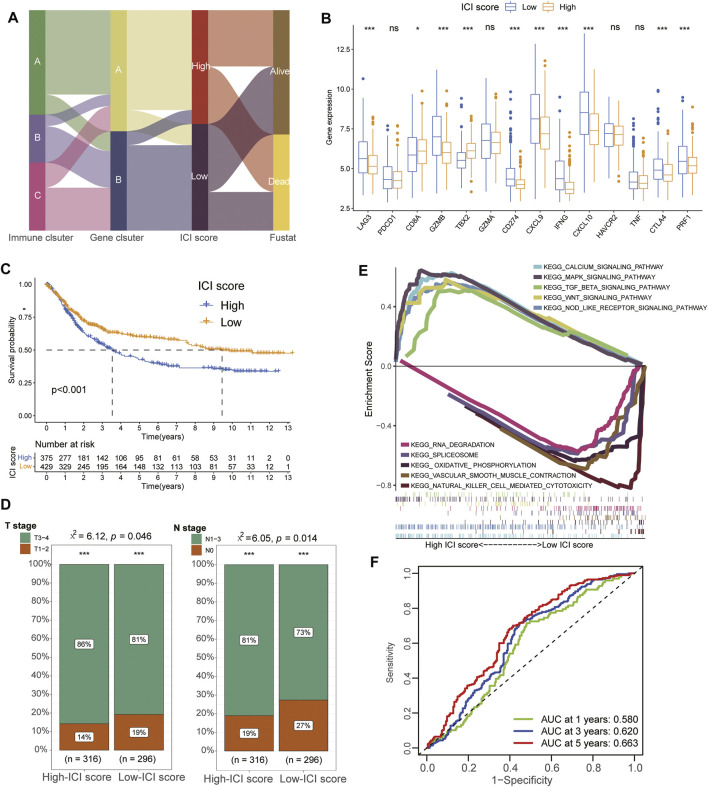
FIGURE 3.
Construction and identification of characteristics for ICI Score. (A) Alluvial diagram showing the ICI gene cluster distribution from different ICI gene clusters, ICI score groups and final survival outcomes. (B) The expression of immune-checkpoint-associated signatures (CD274/PD-L1, PDCD1, LAG3, CTLA4 and HAVCR2) and immune-activity-related genes (CD8A, CXCL9, CXCL10, GZMA, GZMB, PRF1, IFNG, TNF and TBX2) in different ICI score groups. (C) Kaplan-Meier curves of overall survival (OS) for the GC patients in high and low ICI score groups. (D) Difference of TMN stages between different ICI score groups. (E) The results of GSEA showing that Calcium signaling pathway, MAPK signaling pathway, TGF beta signaling pathway, WNT signaling pathway and NOD like receptor signaling pathway were significantly enriched in high-ICI score group while RNA degradation, Spliceosome, Oxidative phosphorylation, Vascular smooth muscle contraction and Natural killer cell mediated cytotoxicity were enriched in the low-ICI score group. (F) ROC analysis showed the 1-year, 3-year, and 5-year AUC values of the ICI scores in predicting the prognosis of GCs were 0.580, 0.620, and 0.663, respectively.

