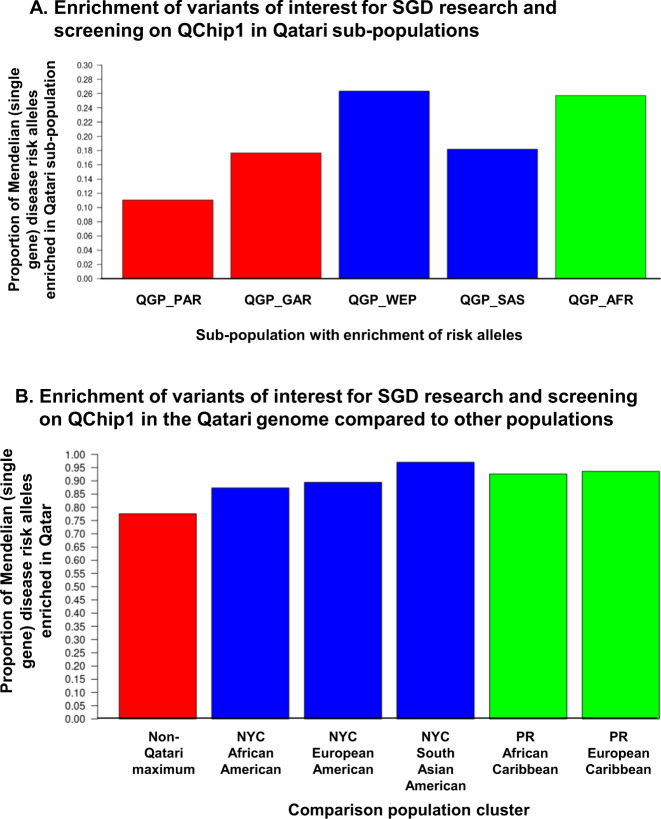
Fig. 1. Population distribution of QChip1 variants observed in Qatar.
In order to demonstrate the population-specific value of QChip1, the risk alleles that were discovered by genome/exome sequencing, prioritized in the knowledgebase, included in the array design, successfully genotyped, and observed in array data for at least one of n = 2,708 Qataris are provided for download in Supplementary Table 1 and online at the Qatar Genome Browser (http://qchip.biohpc.cornell.edu). Shown is a summary of the population enrichment of these variants. A Enrichment of potentially pathogenic variants on QChip1 in Qatari subpopulations. In order to determine if Mendelian disease risk alleles were enriched in single Qatari subpopulations, a cross-population allele frequency comparison was conducted for five ancestries observed in Qatar (k1, QGP_PAR, Peninsular Arabs; k2, QGP_GAR, General Arabs; k4, QGP_WEP, Arabs of Western Eurasia and Persia; k5, QGP_SAS, South Asian Arabs, and k3, QGP_AFR, African Arabs). Not shown, QGP_ADM, Admixed Arabs. For each subpopulation, the risk allele frequency was compared to the maximum of the other four subpopulations. Shown is the proportion that was highest in the subpopulation for (left-to-right) QGP_PAR, QGP_GAR, QGP_WEP, QGP_SAS, and QGP_AFR. B Enrichment of potentially pathogenic variants on QChip1 in the Qatari genome relative to non-Qatari. The non-Qatari genomes were residents of New York City (total n = 226) and Puerto Rico (n = 51). The ancestry proportions of these 226 non-Qatari genomes in 5 clusters (k1 to k5) were calculated as described in Fig. 2 (combined analysis of non-Qataris and Qataris using ADMIXTURE68), the lowest cross-validation error was for k = 5, with the non-Qataris falling in 3 clusters (African-Americans from NYC, n = 60, k3; European-Americans from NYC, n = 153, k4; South Asian-Americans from NYC, n = 13, k5; Puerto Ricans of European Ancestry, k4; and Puerto Ricans of Afro-Caribbean Ancestry, k3). More details of the population structure were made available in Fig. 2 (Qataris) and Supplementary Fig. 1 (non-Qataris). Shown is the percentage of n = 32,674 potentially pathogenic variants in Mendelian (single gene) disorder genes that were observed in at least one Qatari and have a risk (minor) allele frequency in Qatar higher than in non-Qatari populations. The proportion of variants was calculated that were at elevated minor allele frequency (enriched) in the Qatari genome relative to the genomes of the 5 non-Qatari population clusters tested: USA African-American (k3), USA European-American (k4), USA South-Asian American (k5), PR Afro-Caribbean (k3), PR European (k4). Shown from left-to-right is the proportion that are enriched in Qatar relative to the maximum of all 5 populations, followed the proportion enriched relative to each individual population.

