Figure 2.
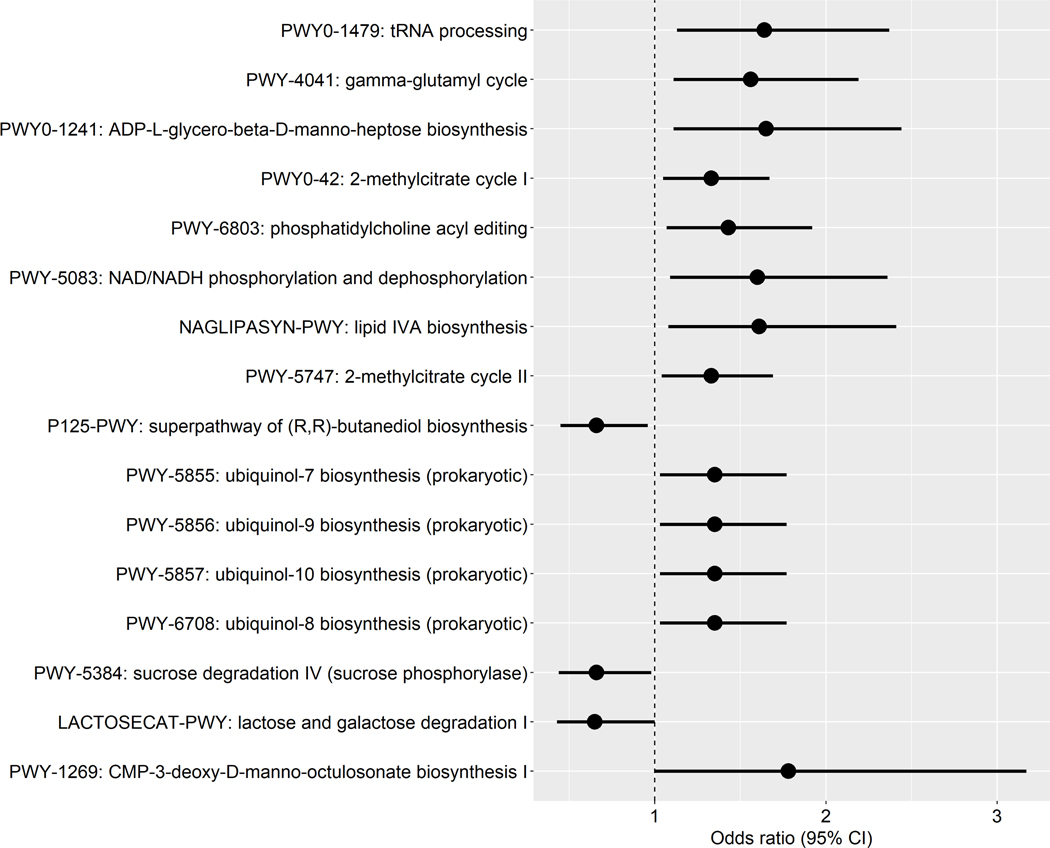
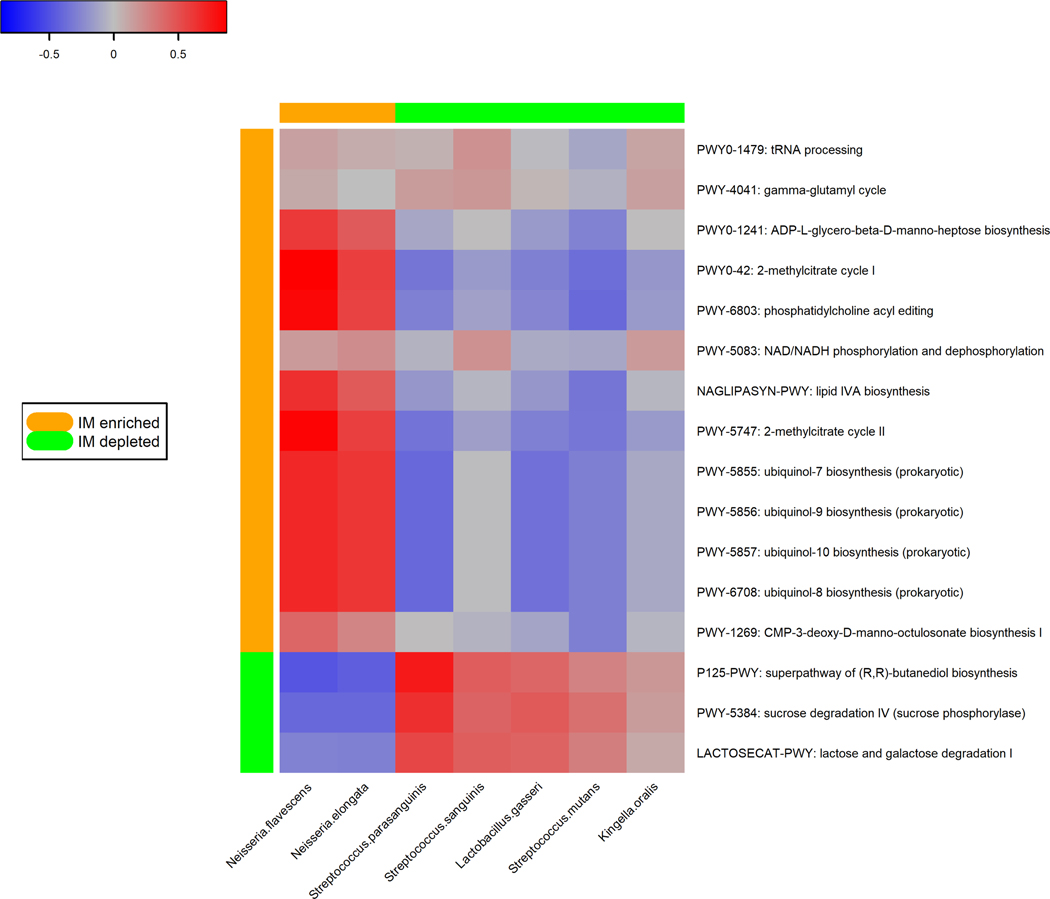
Pathways in the oral microbiome associated with gastric intestinal metaplasia. (A) Forest plot of odds ratios (ORs) and 95% confidence intervals (95% CI) for associations between clr-transformed pathway relative abundance and gastric IM in standard conditional logistic regression models. (B) Correlations between IM-associated oral species and functional pathways. Spearman correlation coefficient values were estimated for each pairwise comparison of clr-transformed species and pathway relative abundance. Here we show only species in Table 2 and Figure 1 with known contribution to each pathway according to the species-specific pathway data.


