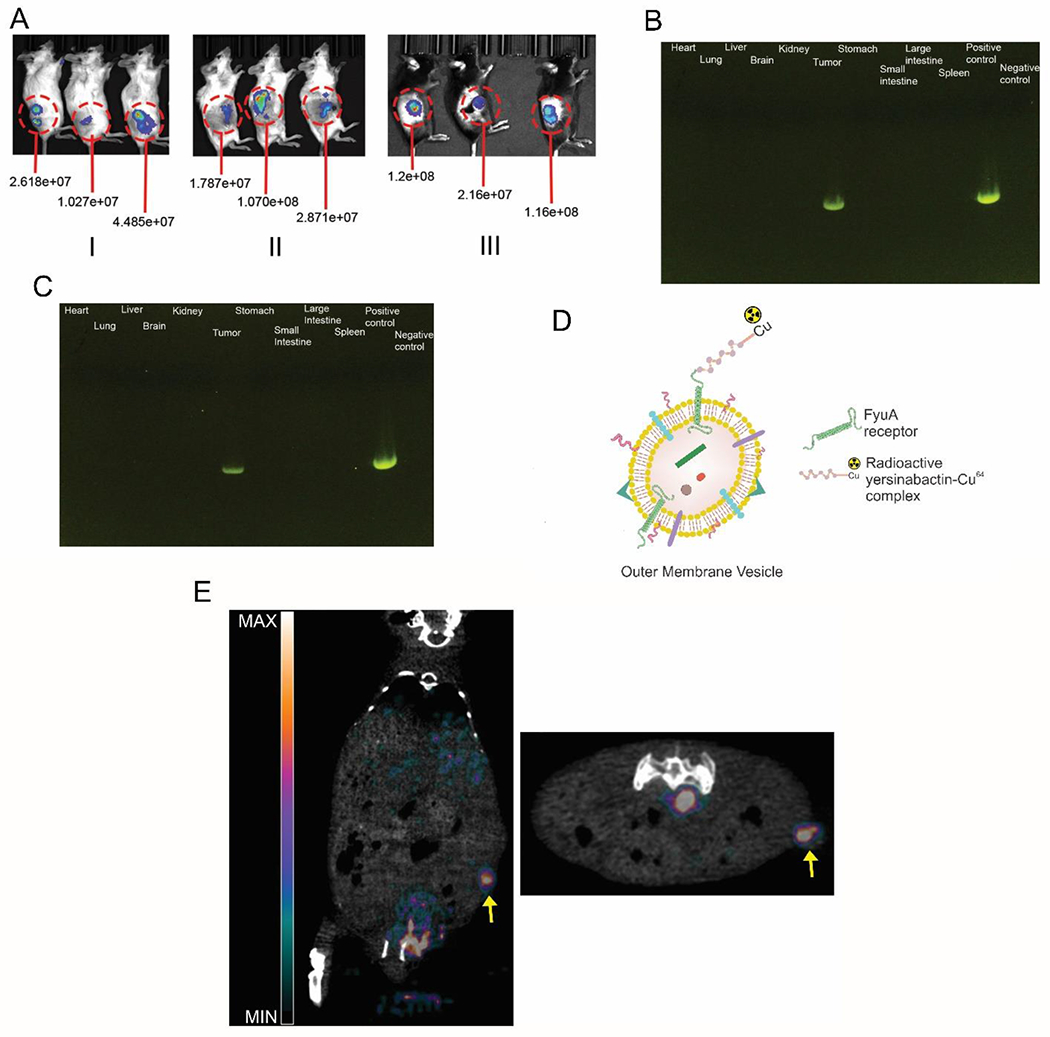
Figure 4:

(A) Bioluminescence images showing (I) EcN-luxCDABE accumulation in 4T1 tumors in BALB/cJ mice after intravenous injection at the end of 24 hours (n=5). (II) ΔElux accumulation in 4T1 tumors in BALB/cJ mice after intravenous injection at the end of 24 hours (n=5). (III) ΔElux accumulation in MC38 tumors in C57BL/6 mice after intravenous injection at the end of 24 hours (quantified intensity units in radiance) (n=5). PCR analysis of tissue sample for detecting pecol19A-ClyA-Hy plasmid fragments in 4T1 (B) and MC38 (C) tumors (731bp) (n=4). (D) Schematic depicting the labelling of OMVs with the 64Cu-YbT complex. (E) PET/CT images along the longitudinal (left) and transverse (right) axis showing in-vivo biodistribution of 64Cu-YbT labelled OMVs and preferential uptake in tumor. Arrow points towards the tumor location (n=3).
