
Figure 5:
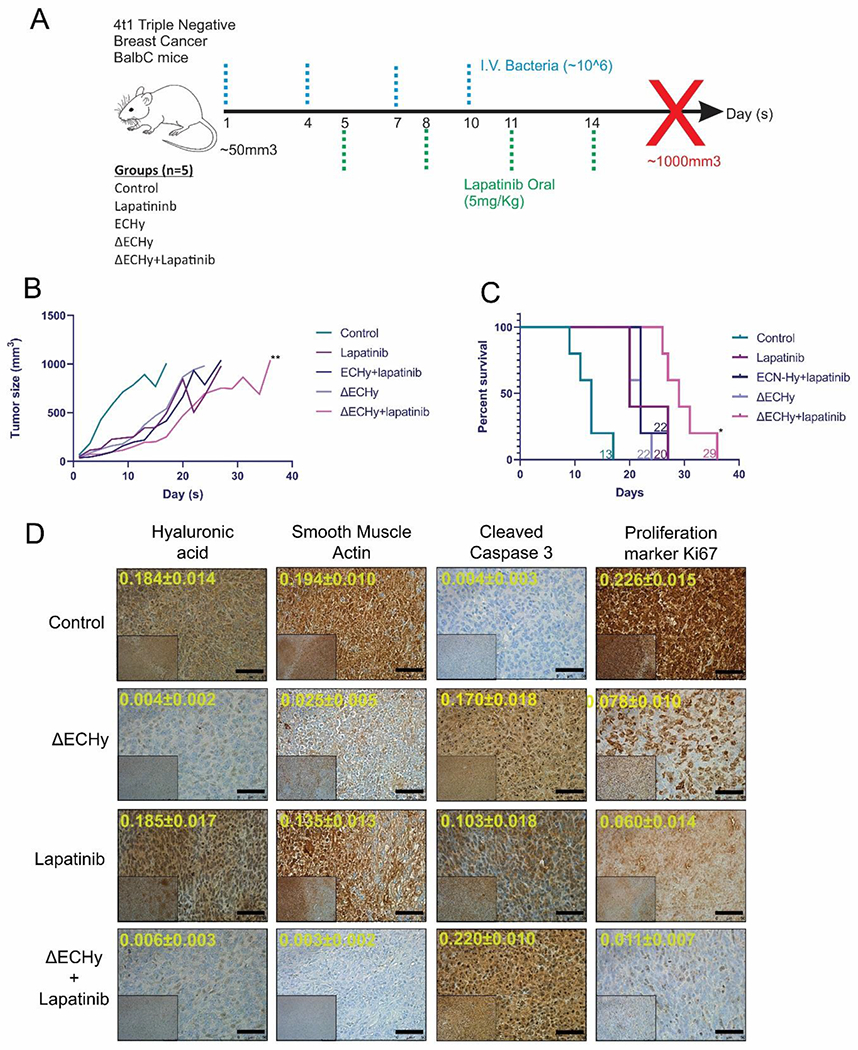
(A) Treatment protocol for the in-vivo analysis of HA degradation in 4T1-BALB/cJ mice. (B) Line plot for different groups showing mean tumor volume over the course of study (n=5). ΔECHy+lapatinib vs lapatinib comparison was performed using wilcoxon matched-pairs signed rank paired t-test, p=0.0078, p-value summary=**, data represented as mean. (C) Kaplan meier survival analysis for different groups tested. The four groups were compared, and the median survival time was calculated using the log-rank (Mantel–Cox) test, which is indicated for each group (corresponding color-coded numerals) (*p=0.0421). (D) Representative images for IHC analysis of tumor tissues from different treatment groups: saline control, ΔECHy, lapatinib and ΔECHy+lapatinib (inset x100 and outset x400). Quantification of markers (arbitrary units) is indicated in yellow digits for each image (data represented as mean±SD, compared using two-way anova (tukey’s multiple comparisons test). Black bar for scale corresponds to 50 μm.