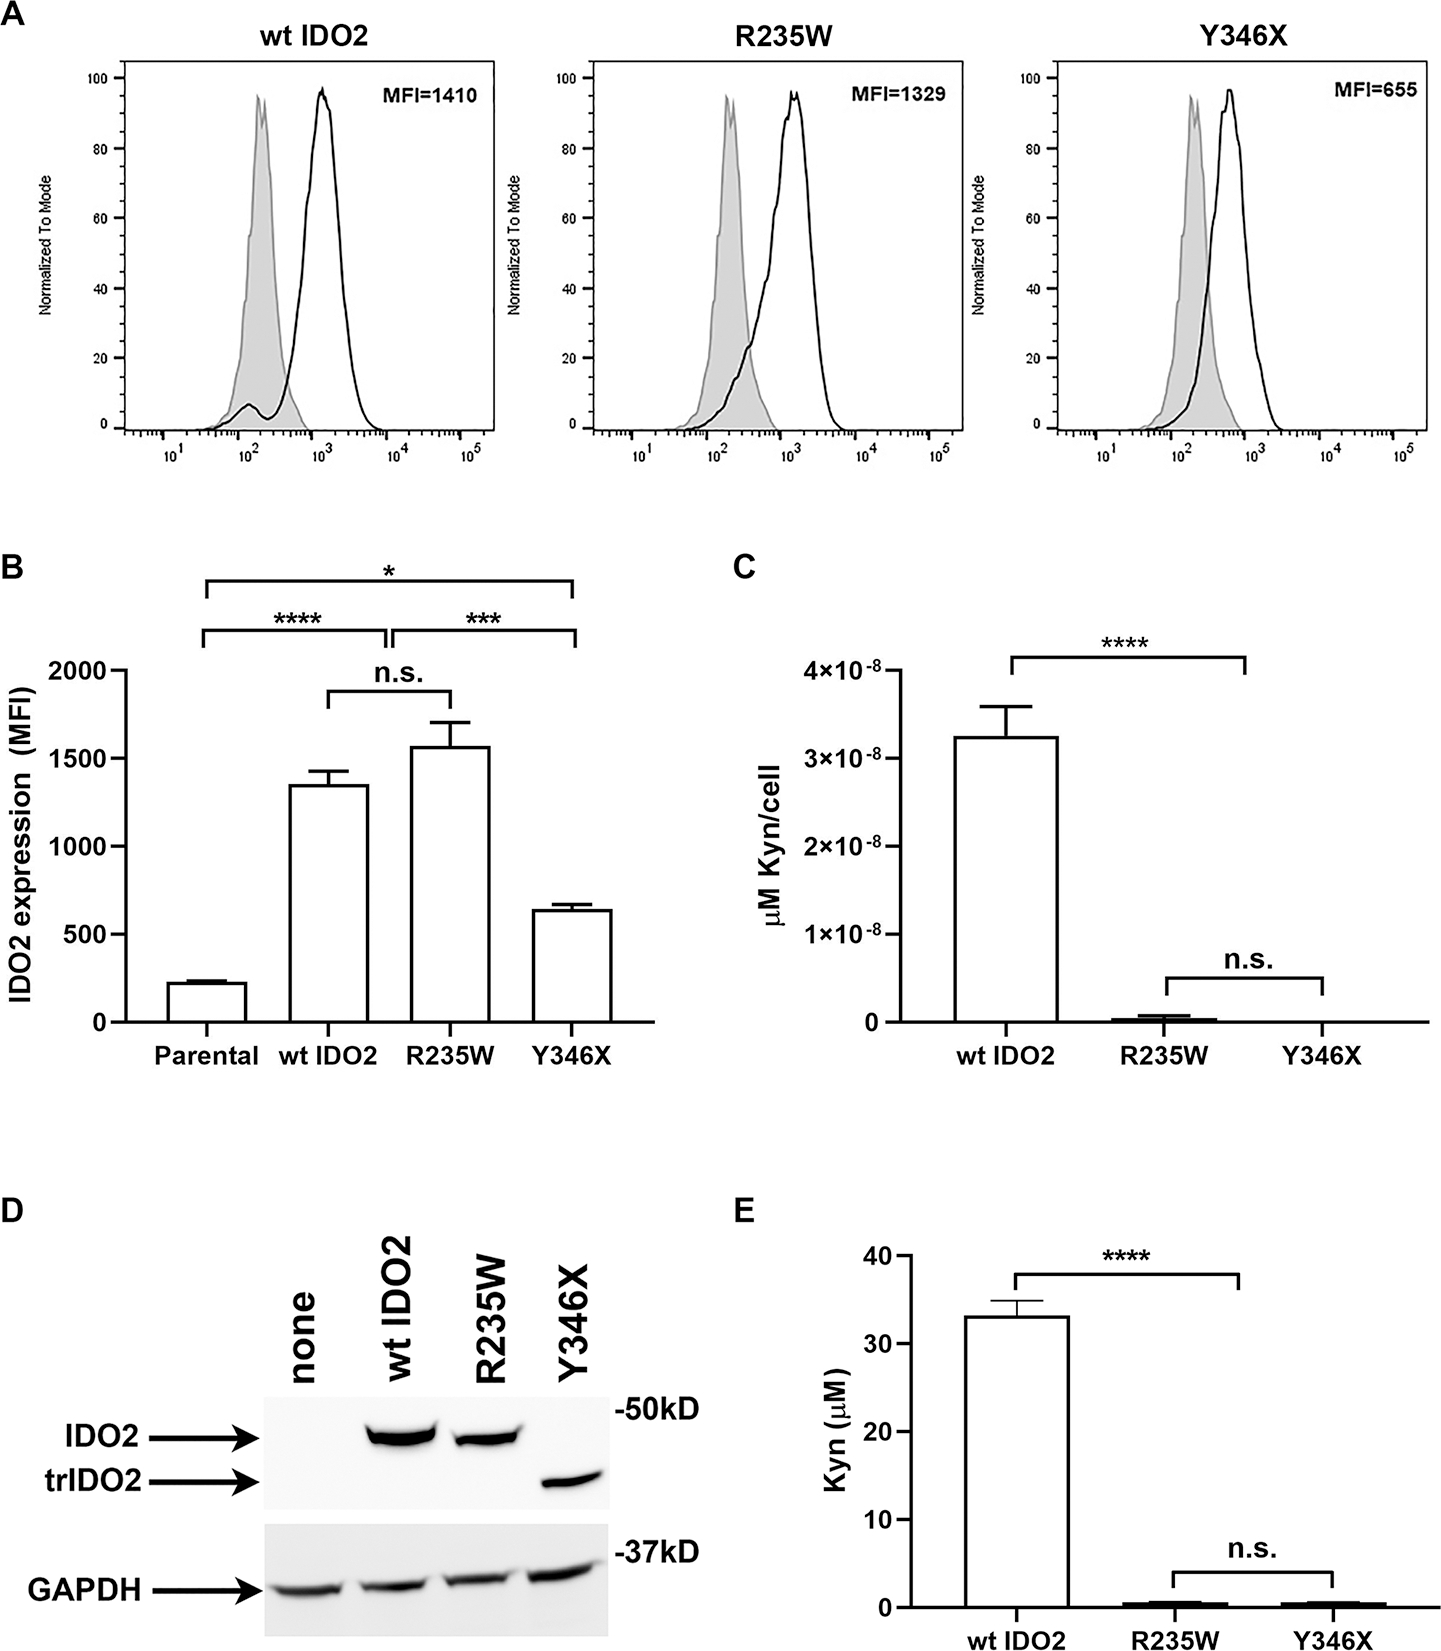
Figure 2. R235W and Y346X IDO2 are enzymatically inactive.

293-T-REx™ (Trex) cells were stably transfected with V5-tagged wt, R235W, or Y346X IDO2. (A) IDO2 expression in the transfected cells was measured by staining for the V5 tag using intracellular flow cytometry. Representative FACS plots show IDO2 levels in transfected (bold line) compared to untransfected Trex cells (filled histogram). (B) Graph shows the mean IDO2 expression ± SEM for n=3 each. (C) Kynurenine (Kyn) in the supernatants were measured by Ehrlich’s Assay. Graph indicates the mean amount of Kyn, normalized for IDO2 expression per cell, ± SEM for n=3 each. (D) Cell lysates were immunoblotted with V5 antibody to normalize IDO2 levels. GAPDH was used as a loading control. (E) Equal amounts of IDO2 were evaluated for tryptophan catabolic activity using an in vitro enzymatic assay. Kyn production was measured by ELISA. Graph shows mean amount of Kyn ± SD from n=3 each. *p<0.05, ***p<0.001, ****p<0.0001, n.s., not significant.
