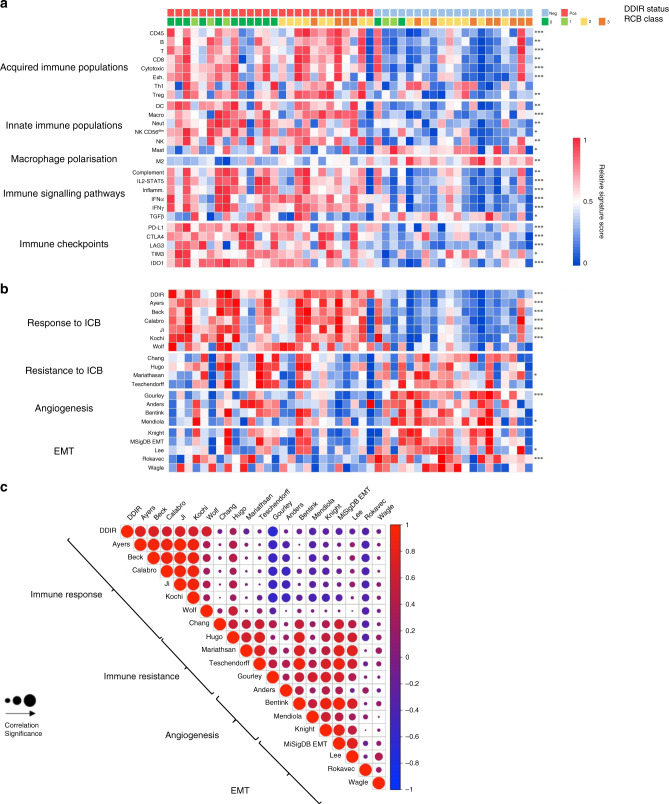
Fig. 3. Immune signalling, angiogenesis and EMT in DDIR-negative and -positive tumours.
a Panels 1 and 2 = Gene signatures predicting acquired (panel 1) and innate (panel 2) immune cell infiltrating populations in DDIR-negative (left) and DDIR-positive (right) tumours; ex T cells exhausted T cells, DC dendritic cells, NK natural killer cells. Panel 3 = macrophage polarisation. Panel 4 = Immune signalling pathways identified as active in DDIR assay-positive and -negative tumours. Panel 5 = Expression of immune-checkpoint genes in DDIR-negative and positive tumours. DDIR status and RCB score (0–3) is indicated on x axis for all 46 samples. *P < 0.05; **P < 0.01; ***P < 0.001, unpaired t test. b Panel 1 = Gene signatures derived from claraT analysis and reported to predict response to immune-checkpoint blockade, as well as the DDIR assay [8, 28–30, 58–60]. Panel 2 = Gene signatures derived from claraT analysis and reported to predict resistance to ICB in DDIR-negative and -positive tumours [27, 31–33]. Panel 3 = Gene signatures associated with increased angiogenic signalling or response to anti-angiogenic agents [34–36, 61]. Panel 4 = Gene signatures associated with increased EMT signalling [26, 37–39, 62]. DDIR status and RC score (0–3) is indicated on x axis for all 46 samples. *P < 0.05; **P < 0.01; ***P < 0.001, unpaired t test. c Correlations of gene signatures predicting angiogenic, EMT or immune signalling. Signatures predicting angiogenic or EMT signalling negatively correlated with those predicting immune signalling. Significance of correlation is shown using size, red indicates a positive correlation and blue negative correlation (gene signature references as for Fig. 4b).

