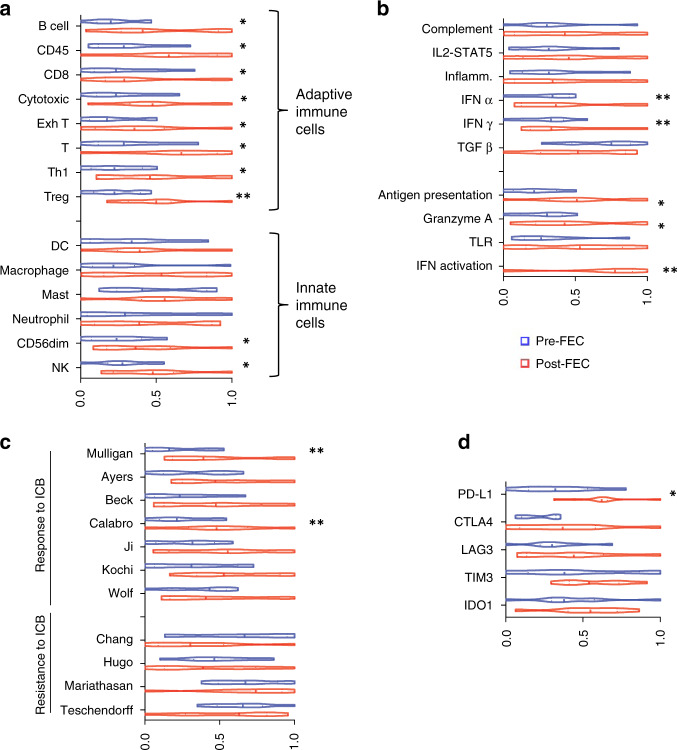
Fig. 5. Immune gene expression pre- and following three cycles FEC NACT in DDIR-negative tumours (eight paired samples).
a Predicted immune cell populations in baseline tumour biopsies and post-FEC in DDIR-negative tumours where blue indicates gene expression score pre-treatment and red following three cycles of FEC chemotherapy. *P < 0.05, **P < 0.01. b Upregulation of immune signalling pathways post-FEC in DDIR-negative tumours. *P < 0.05, **P < 0.01. c Signature scores: upper panel: signatures reported to predict response to ICB. Lower panel: signatures reported to predict resistance to ICB and an inflamed microenvironment are shown in the lower panel. *P < 0.05, **P < 0.01. d Gene expression of immune checkpoints at baseline and following three cycles FEC chemotherapy in DDIR negative tumours. *P < 0.05, **P < 0.01.

