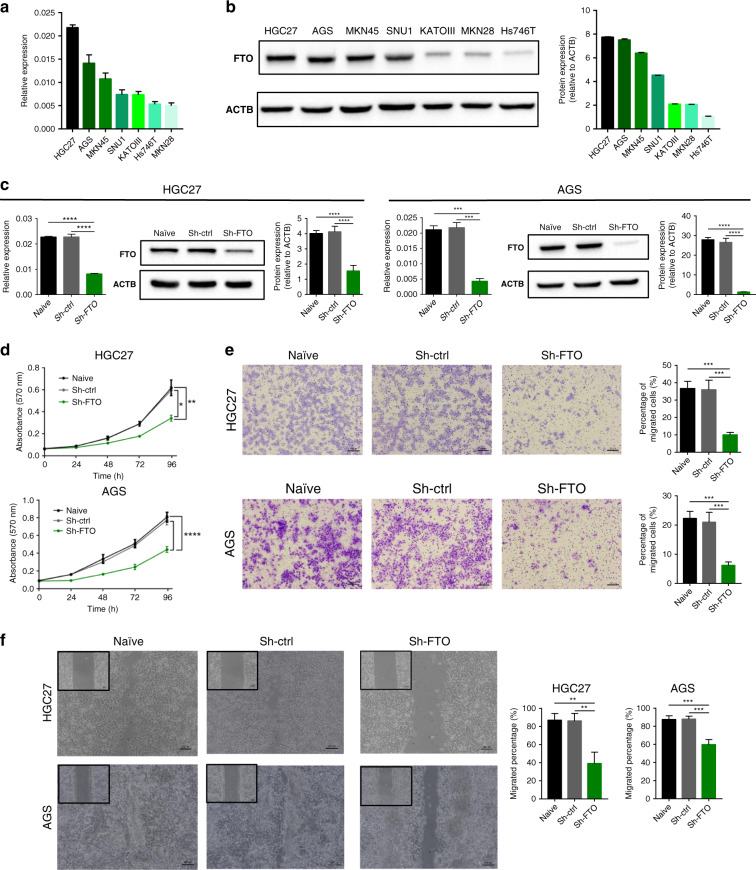
Fig. 2. Stable knockdown of FTO suppressed cell proliferation and migration in gastric cancer cells.
a FTO mRNA expression in seven GC cell lines. b Western blotting image of FTO (left) and its relative signal intensity (right) in seven GC cell lines. c Stable knockdown of FTO by shRNA effectively decreased its both mRNA and protein expression level in HGC27 and AGS cells. d Cellular proliferation rate evaluated by MTT assay of sh-FTO cells compared to control cells in HGC27 (top) and AGS cell lines (bottom). e Representative image of cells that migrated through the permeable membrane of a transwell migration plate (left) and quantification of migrated cells (right) of sh-FTO and control cells in HGC27 and AGS cell lines. f Left: Representative image of monolayer of post scratch in HGC27 (16 h post scratch) and AGS cell lines (24 h post scratch). Right: Quantification of migrated cells in 16 h/24 h post scratch compared to 0 h post scratch. *p < 0.05, **p < 0.01, ***p < 0.001, and ***p < 0.0001 by one-way ANOVA test.

