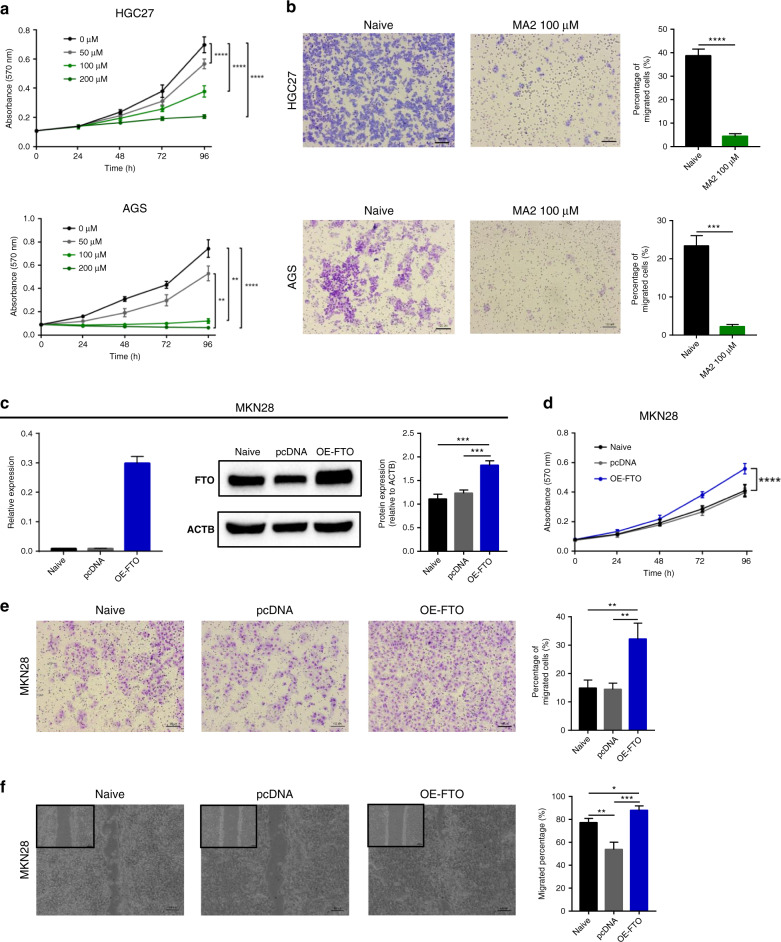
Fig. 3. FTO inhibitor (MA2) suppressed oncogenic role and overexpression of FTO enhanced the tumour progression in GC cell lines.
a Cellular proliferation rate was inhibited in a dose-dependent manner in MA2-treated cells compared to un-treated cells in HGC27 (top) and AGS cell lines (bottom). b Representative image of migration assay (left) and quantification of migrated cells (right) of MA2-treated cells compared to un-treated cells in HGC27 and AGS cell lines. c Transient overexpression (OE) of FTO significantly increased both mRNA and protein expression level in MKN28 cells. d Cellular proliferation rate was increased in OE-FTO cells compared to control cells in MKN28 cell line. e Representative image of migration assay (left) and quantification of migrated cells (right) of OE-FTO and control cells. f Left: Representative image of monolayer of 24 h post scratch in MKN28 cell line. Right: Quantification of migrated cells in 24 h post scratch compared to 0 h post scratch in MKN28 cell line. *p < 0.05, **p < 0.01, ***p < 0.001, and ***p < 0.0001 by two-tails-t-test, or by one-way ANOVA test.

