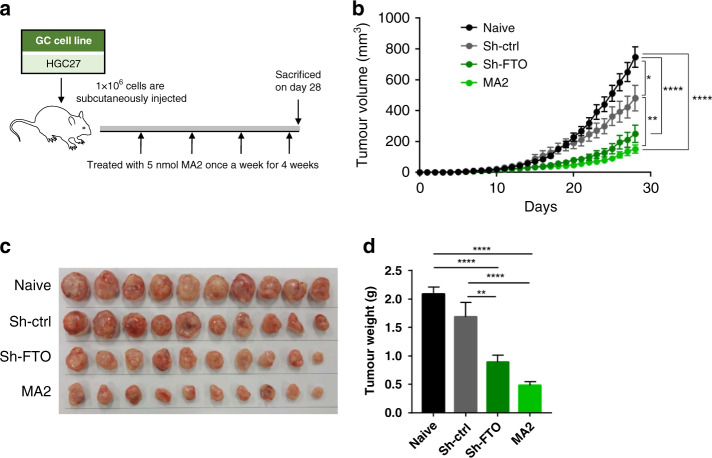
Fig. 4. Stable knockdown of FTO and inhibition by MA2 resulted in tumour growth inhibition in HGC27 xenografts.
a The schematic diagram of the in-vivo experiment and MA2 treatment in HGC27 xenografts. b Time course tumour volume alteration in each group. c Representative image of collected xenograft tumours. d Average weight of collected xenograft tumour between groups. *p < 0.05, **p < 0.01, and ***p < 0.0001 by one-way ANOVA test.

