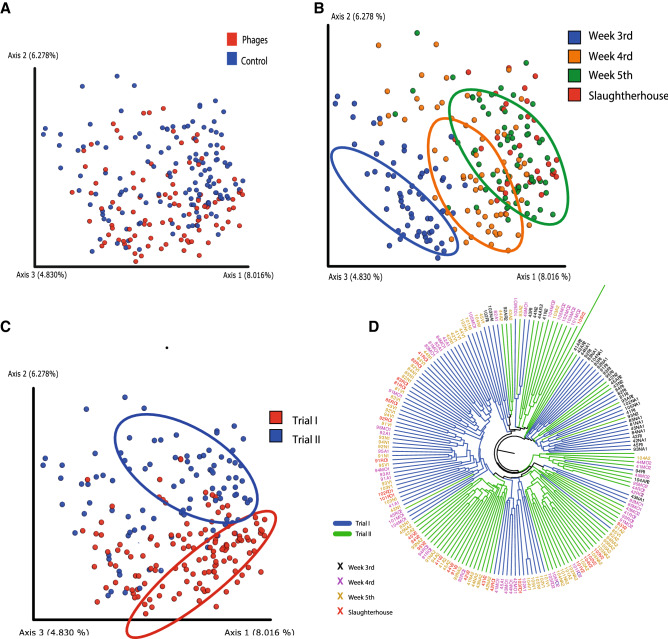
Figure 3.
Similarity between the structure of bacterial communities found in cecum of broiler chicken based on Bray Curtis dissimilarity metric. (A–C) Principal Coordinate Analysis (PCoA) where samples are colored by treatment (A) age of the animals (in weeks) (B) and by trial (C). Ellipses were manually overlaid to encompass the majority of the sample points of a given feature. (D) UPGMA clustering colored by cycle and sampling week. This figure was made using the Qiime2 package version 2018.1156 and its plugins (https://qiime2.org).

