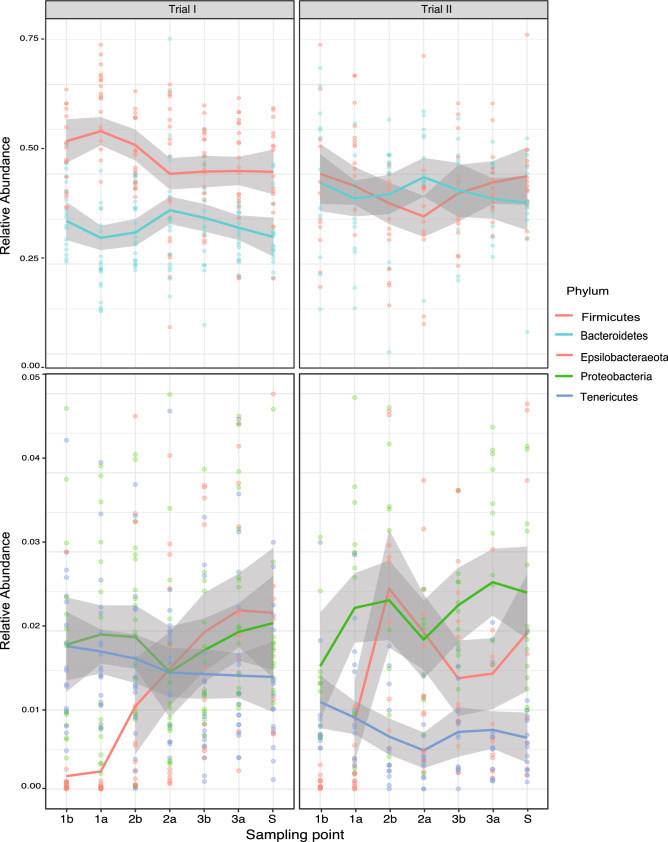
Figure 4.
Relative abundance of dominant phyla identified in the microbiome of cecum of broilers. Results are presented discriminated by trial over time, shown as dose days. Sample days are indicated with the nomenclature of the dose number followed by the letter a or b for samples taken before and after the delivery of the treatments, respectively. The results at slaughterhouse are indicated as (S). Upper and lower panels show the range of abundance of Firmicutes and Bacteroidetes compared to other phyla. The color gray indicates the standard deviation of the mean abundance. This figure was generated using Phyloseq package in R v 1.2.5 (https://www.r-project.org/).

