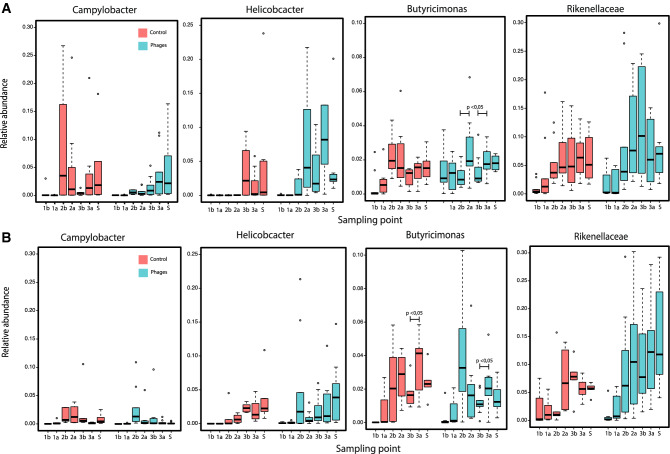
Figure 7.
Relative abundance of Bacterial taxa significantly associated with the treatment. Results are discriminated by trial over time, shown as sampling point as in Fig. 1. Results are presented by Trial 1 (A) and Trial 2 (B). Control groups are depicted in salmon while treated groups are shown in blue. The body of the box plot represents the first and third quartiles of the distribution and the median line of abundance of all ASV assigned to the corresponding genera. The whiskers extend from the quartiles to the maximum or minimum data within 1.5× interquartile range, with outlayers beyond. ANOVA test P < 0.05 shows significant differences in microbial abundance of Butyricimonas before and after the dose of phages. This figure was generated using Phyloseq package in R v 1.2.5 (https://www.r-project.org/).

