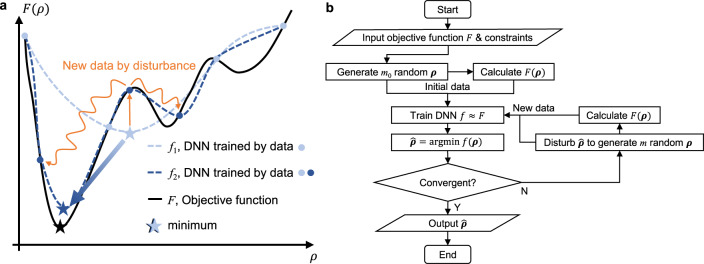
Fig. 1. Schematics of the proposed self-directed online learning optimization.
a Schematic illustration of self-directed online training. The initial batch of training data (light-blue dots) is randomly located. The DNN f1 (dashed light-blue line) trained on the first batch of data only gives a rough representation of the true objective function F (solid black line). The second batch of training data (dark-blue dots) are generated by adding disturbance (orange curve) to the minimum of f1. After trained with two batches, the DNN f2 (dashed dark-blue line) is more refined around the minimum (the region of interest), while remains almost the same at other locations such as the right convex part. f2 is very close to finding the exact global minimum point. b Flow diagram of the algorithm.

