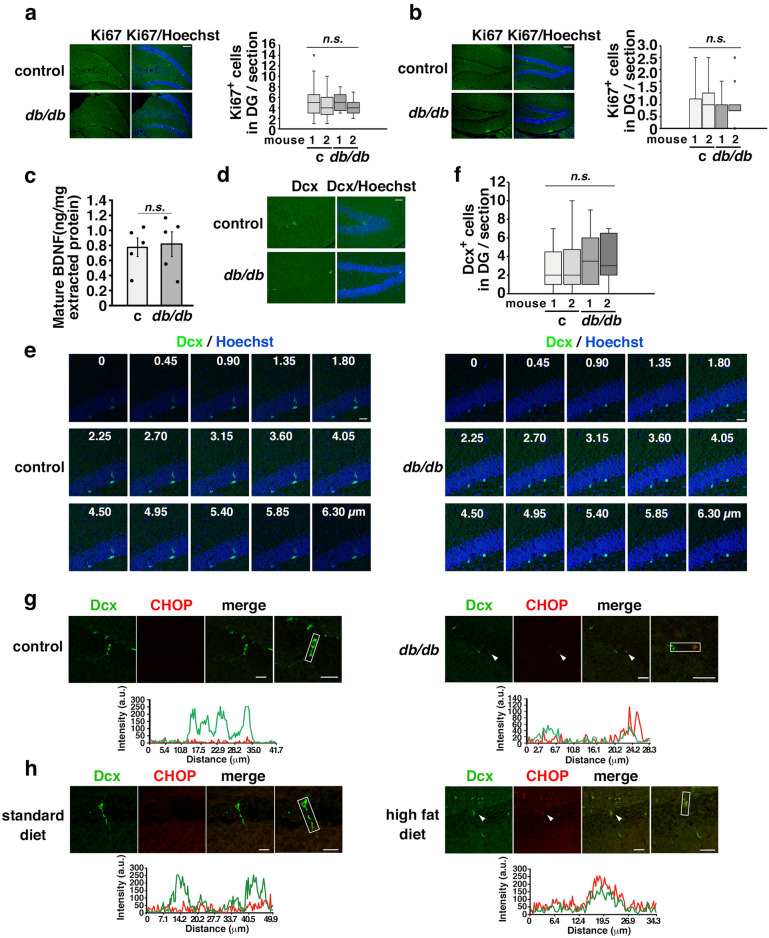
Figure 3.
CHOP and Dcx were coexpressed in the immature neurons of mice with long-term obesity. (a, b) Ki67-positive ( +) cells in the SGZ of the DG/section in 10-week-old (c: control mice, n = 2; db/db mice, n = 2,) (a) and 45-week-old (control mice, n = 2; db/db mice, n = 2) (b) db/db mice. Scale bars: 100 µm. The box-and-whisker plot represents the number of cells per section from each animal. Statistical significance (p < 0.05) was determined by one-way ANOVA followed by the Bonferroni post-hoc test. (c) Mature BDNF expression in the hippocampi of 46-week-old mice. Control mice (n = 5); db/db mice (n = 5). Statistical significance (p < 0.05) was determined by Student’s t test. (d–f) Number of Dcx+ cells in the DG/section in 45-week-old control and db/db mice. Serial sections of the DG from zero to 6.30 µm imaged by confocal microscopy. Scale bars: 40 µm (d); 20 µm (e). The box-and-whisker plot represents the number of cell per section from each animal. Control mice (n = 2); db/db mice (n = 2) (f). Statistical significance (p < 0.05) was determined by one-way ANOVA followed by the Bonferroni post-hoc test. (g, h) CHOP was expressed in the Dcx-expressing neurons in 45-week-old db/db mice (g) and 69- to 71-week-old APP23 mice with long-term HFD-induced obesity (h). (g) Control mice (n = 2, 12 brain slices); db/db mice (n = 2, 12 brain slices). (h) Standard diet APP23 mice (n = 2, 8 brain slices); high fat diet APP23 mice (n = 3, 12 brain slices). The arrowheads in each panel indicate Dcx- and CHOP-positive cells. Scale bars: 20 µm. The fluorescence intensity profiles are shown in the square boxes (bottom panels).

