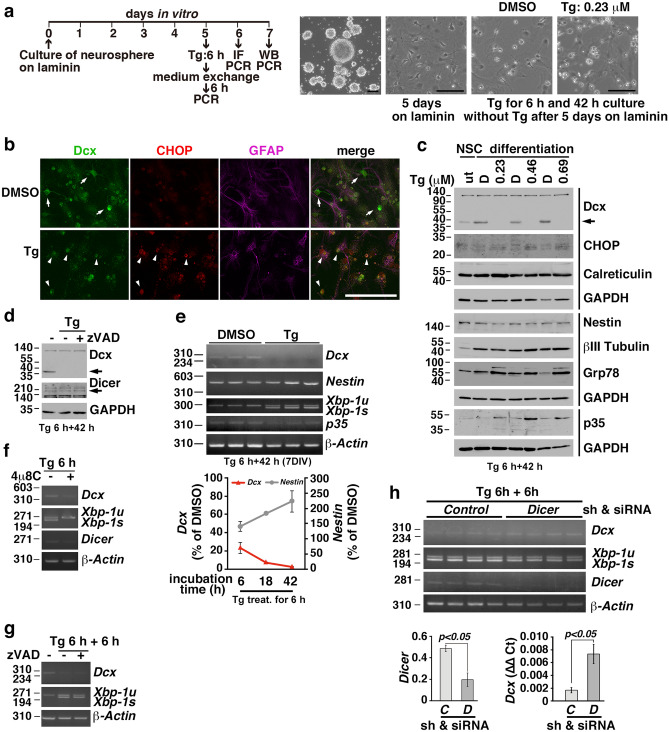
Figure 4.
Thapsigargin reduced Dcx expression in immature neurons by decreasing the Dcx mRNA levels. (a) Experimental schedule and representative images. Hippocampal neurospheres from mice were differentiated on laminin for 5 days. The cells were treated with thapsigargin (Tg) for 6 h, washed once with medium, and then cultured in medium without Tg for the indicated amounts of times. (b) Immunostaining for Dcx, CHOP, and GFAP in differentiating cells cultured on laminin after Tg treatment for 6 h and in the absence of Tg for 18 h. Arrows: Dcx-expressing cells; arrowheads: Dcx- and CHOP-expressing cells. Scale bars: 100 µm (a, b). (c) Several neuronal lineage marker proteins, i.e., Dcx, calreticulin, nestin, βIII tubulin, were expressed in differentiating NSCs cultured on laminin, and the expression of the ER stress markers Grp78 and CHOP was induced by Tg. The arrow indicates Dcx. Cells were lysed at 42 h after Tg treatment for 6 h (Tg 6 h + 42 h). D: DMSO. (d) The cells were pretreated with 40 μM zVAD for 30 min, after which Tg (0.23 μM) was added and the cells were incubated for 6 h. After the medium was changed, the cells were incubated with 40 μM zVAD without Tg for 42 h. (e) Semiquantitative RT–PCR at 42 h after treatment with Tg (0.23 μM) for 6 h (upper panels). The mRNA levels of Dcx in cells cultured in medium without Tg were decreased at the indicated times after treatment with 0.23 μM Tg for 6 h (lower panel). The error bars represent the SEMs of 3 independent experiments. (f, g) The mRNA levels of Dcx were not changed after treatment with Tg (0.23 μM) for 6 h in the presence of the IRE1 inhibitor 4µ8C (f) or at 6 h after 0.23 μM of Tg treatment for 6 h in the presence of 40 μM zVAD (g). (h) Semiquantitative RT–PCR analysis of differentiating cells at 6 h after 0.23 μM Tg treatment for 6 h after the knockdown of Dicer using an shRNA and an siRNA (upper panels). Semiquantitative RT–PCR analysis of Dicer (lower left panel, p < 0.05, Student’s t test). shRNA and siRNA for the Control (C) and for Dicer (D). Real-time RT–PCR analysis of Dcx (lower right panel, p < 0.05, Student’s t test). The error bars represent the SEMs.

