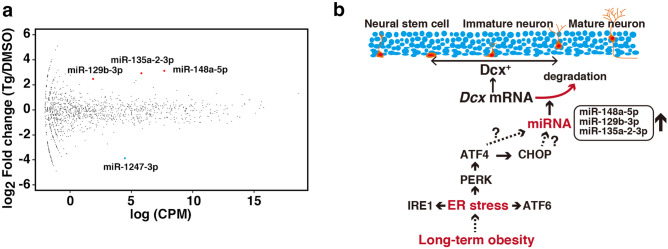
Figure 5.
ER stress increased the miRNA expression in differentiating neurospheres. (a) Differential expression analysis of miRNAs in DMSO-treated cells (n = 3) and thapsigargin-treated cells (n = 3) was performed using edgeR. The y-axis indicates the expression ratio [log2 (fold change)], and the x-axis indicates the average of expression [log (CPM)]. Solid red circle: upregulated miRNA; solid blue circle: downregulated miRNA. FDR < 0.05. (b) Model of the effect of long-term obesity on neural maturation during AHN.

